|
 |
|
| |
Debugging your programs
In this section, you will debug a Java program.
- In the Package Explorer view in the Java perspective, double-click junit.samples/VectorTest.java
to open it in an editor.
- Place your cursor on the vertical ruler along the left edge of the editor
area on the following line in the setUp() method:
fFull.addElement (new Integer(1));
and double-click on the ruler to set a breakpoint.
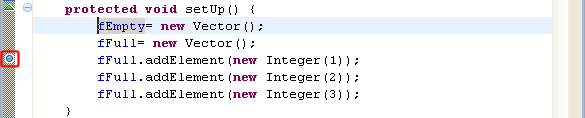
The breakpoint icon indicates the status of the breakpoint. The plain
blue breakpoint icon indicates that the breakpoint has been set, but not yet
installed.
Note: Once the class is loaded by the Java VM, the breakpoint will be
installed and a checkmark overlay will be displayed on the breakpoint icon.
- In the Package Explorer view, select the junit.samples package
and select Debug As, and then Java
Application. When you run a program from a package, you will be
prompted to choose a type from all classes in the package that define a
main
method.
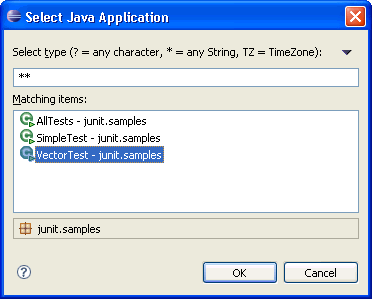
- Select the VectorTest item in the dialog,
then click OK.
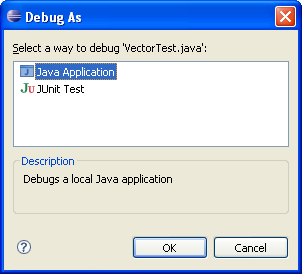
Note: You can also simply hit the debug button 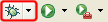 which will launch the currently selected resource or active editor. Select
Java Application when you are prompted to select a way
to debug VectorTest.
which will launch the currently selected resource or active editor. Select
Java Application when you are prompted to select a way
to debug VectorTest.
- The program will run until the breakpoint is reached. When the breakpoint is hit, execution
is suspended, and you are asked whether to open the Debug perspective. Click Yes.
Notice that the process is still active (not terminated) in
the Debug view. Other threads might still be running.
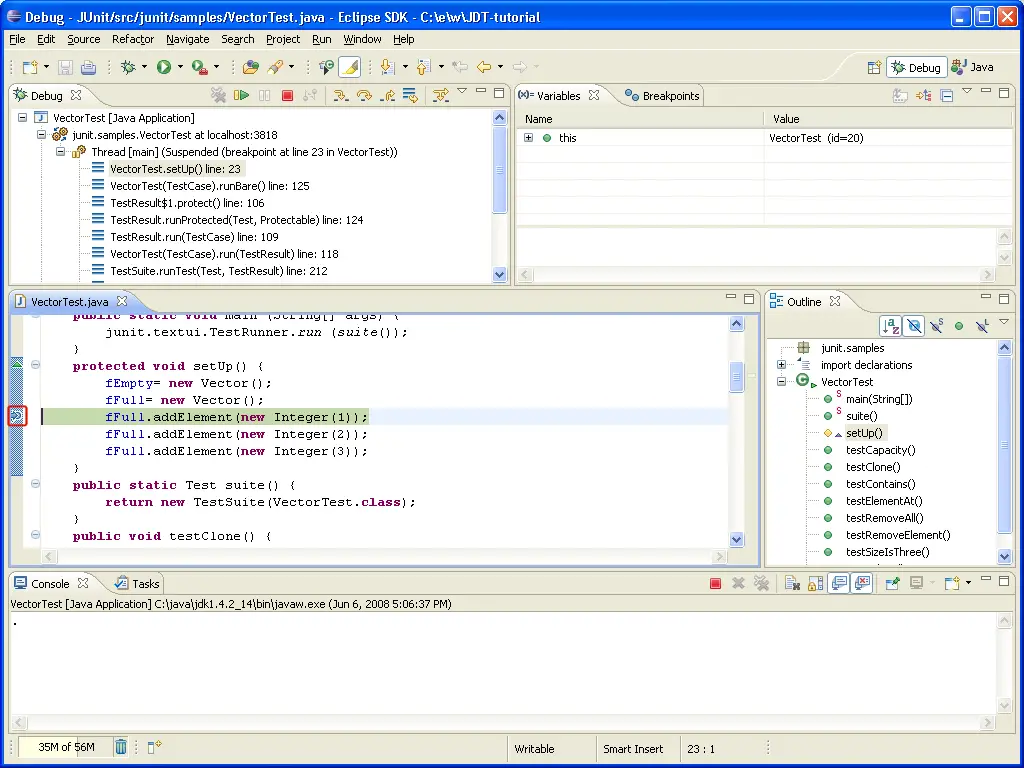
Note: The breakpoint now has a checkmark overlay  since the class
VectorTest was loaded in the Java VM. since the class
VectorTest was loaded in the Java VM.
- In the editor in the Debug perspective, select
new Vector() from the line above
where the breakpoint is set, and from its context menu, select Inspect.
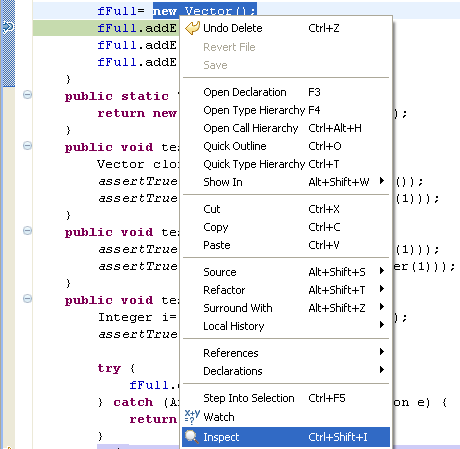
- The expression is evaluated in the context of the current stack frame,
and a pop-up appears which displays the results. You can send a result to
the Expressions view by pressing the key binding displayed in the pop-up.
- Expressions that you evaluate while debugging a program will be listed in
this view. To delete an expression after working with it, select the
expression and choose Remove from its context menu.
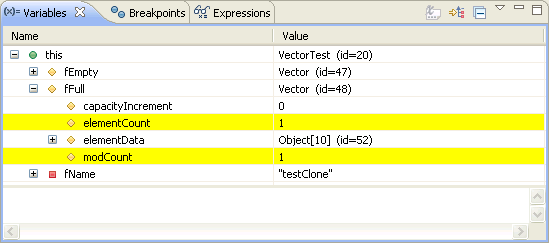
- The Variables view (available on a tab along with the Expressions view) displays the values of the variables in the selected
stack frame. Expand the this.fFull tree in the Variables view until you can see
elementCount.
- The variables (e.g., elementCount) in the Variables view will change when
you step
through VectorTest in the Debug view. To step through the code, click the
Step Over (
 ) button.
Execution will continue at the next line in the same method
(or, if you are at the end of a method, it will continue in the method from
which the current method was called). ) button.
Execution will continue at the next line in the same method
(or, if you are at the end of a method, it will continue in the method from
which the current method was called).
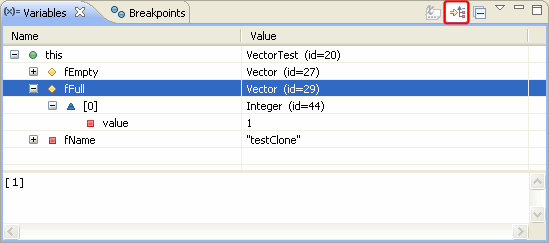
- In the variables view you can choose to see certain types as logical structures. This hides the implementation details of a
type and simply shows it as arrays or fields. You can define logical structures by yourself in the preference page Java > Debug > Logical Structures.
- Try some other step buttons
(Step Into
 ,
Step Return ,
Step Return  ) to
step through the code. Note the differences in stepping techniques. ) to
step through the code. Note the differences in stepping techniques.
- You can end a debugging session by allowing the program to run to
completion or by terminating it.
- You can continue to step over the code with the Step buttons
until the program completes.
- You can click the Resume
(
 ) button to allow the
program to run until the next breakpoint is encountered or until the
program is completed. ) button to allow the
program to run until the next breakpoint is encountered or until the
program is completed.
- You can select
Terminate from the context menu of the program's
process in the Debug view to terminate the program.

Breakpoints
Remote debugging
Local debugging

Adding breakpoints
Resuming the execution of suspended threads
Running and debugging
Suspending threads

Debug preferences
Debug view
Run menu actions
Run and debug toolbar actions
Breakpoints view
Console view
Display view
Expressions view
Variables view
|
|
|


