Debugging an Existing Executable
Use the import feature to import and debug an executable you have already built. This feature will automatically create a project and debug configuration for you. This is helpful if you have an executable built with debug symbols but may not have the project used to build the executable.
Importing Executables for Debugging
- Select the File > Import... menu item.
- In the Import wizard dialog, click C/C++ and select C/C++ Executable.
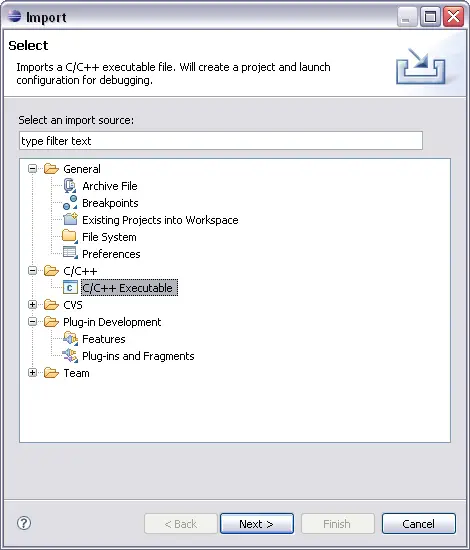
- Click Next.
- In the Import C/C++ Executable Files page of the Import Executable dialog:
- Choose a parser from the Select binary parser list.
- Type the executable path in the Select executable box or click Browse to locate the executable.
- Type or click Browse to enter a directory path in the Search directory box, then select one or more executables from the C/C++ Executable Files list.
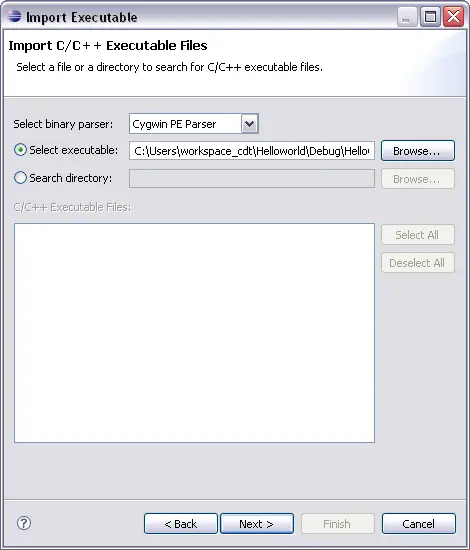
NOTE You can import any executable, but only those built with debug symbols will be let you step through source code and see variable values.
- Click Next.
- In the Choose Project page of the Import Executable dialog:
- To import as a new project, activate New project name and type the project name.
- To import into an existing project, activate Existing project and click Search.
- To add a launch configuration, activate Create a Launch Configuration and select the configuration from the list, then type a name into the Name box.
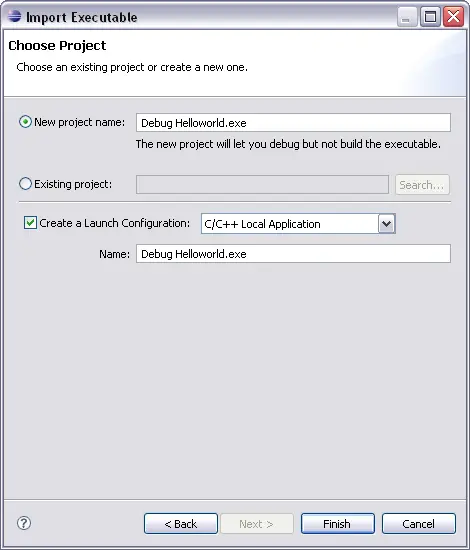
- Click Finish.
The executable is added to the C/C++ Projects view.
- If Create a Launch Configuration was activated, the Debug dialog appears.
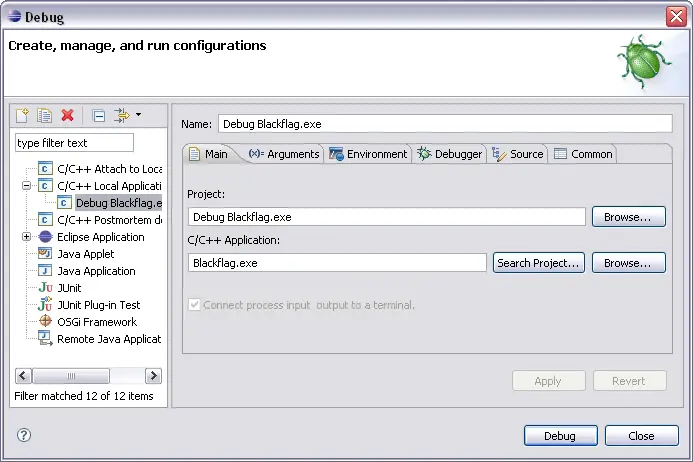
- Click Debug.
The debugger launches and you can begin debugging the executable.
Setting breakpoints
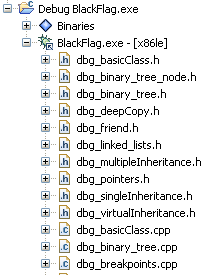
Expand the executable in the C++ Projects view to see the list of source files. Only executables built with debug symbols will show a list of source files. The source files can be opened in the editor so you can set breakpoints. Use these files only for debugging, you can not change them and rebuild the executable with this project.

Debug overview
Debug information

Debugging

Run and Debug dialog box

