Formatting the chart
In addition to the wide range of chart type and appearance choices available through the Chart Type dialog box, Impress provides other ways to customize a chart. This section introduces some of them. Refer to Chapter 4 (Creating Charts and Graphs) in the Calc Guide for more details.
Adding or removing elements from a chart
The default chart includes only two elements: the chart wall and the legend (also known as the key). You can add other elements using the Insert menu. The various choices open dialog boxes in which you can specify details.

Insert menu for charts
Using the Format menu
The format menu has many options for formatting and fine-tuning the look of your charts.
Double-click the chart so that it is enclosed by a gray border. Click Format in the main menu.

Chart format menu
- Object Properties opens a dialog box in which you can specify the area fill, borders, transparency, characters, font effects, and position of the selected element of the chart.
- Position and Size opens the Position and Size dialog box (see “Resizing and moving the chart”).
- Arrangement provides two choices: Bring Forward and Send Backward, of which only one may be active for specific items. Use these choices to arrange overlapping data series.
- Title formats the titles of the chart and its axes.
- Axis formats the lines that create the chart as well as the font of the text that appears on both the X and Y axes.
- Grid formats the lines that create a grid for the chart.
- Legend formats the location, borders, background, and type of the legend.
- Chart Wall, Chart Floor, and Chart Area are described in the following sections.
- Chart Type changes what kind of chart is displayed and whether it is two- or three-dimensional.
- 3D View formats the various viewing angles of 3D chart.
 | Chart Floor and 3D View are only available for a 3D chart. These options are unavailable (grayed out) if a 2D chart is selected.
|
The two main areas of the chart control different settings and attributes for the chart.
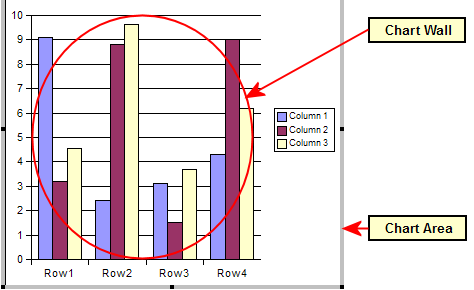
The Chart wall and Chart area
- Chart wall contains the graphic of the chart displaying the data.
- Chart area is the area surrounding the chart graphic. The (optional) chart title and the legend (key) are in the chart area.
|
| Chart Floor, from the Format menu, is only available for 3D charts and has the same formatting options as 3Chart Area and Chart Wall.
|
Knowing the difference between the chart wall and chart area is helpful when formatting a chart.
Resizing and moving the chart
You can resize or move all elements of a chart at the same time, in two ways: interactively, or by using the Position and Size dialog box. You may wish to use a combination of both methods: interactive for quick and easy change, then the dialog box for precise sizing and positioning.
To resize a chart interactively:
- Click on the chart to select it. Green sizing handles appear around the chart.
- To increase or decrease the size of the chart, click and drag one of the markers in one of the four corners of the chart. To maintain the correct ratio of the sides, hold the Shift key down while you click and drag.
To move a chart interactively:
- Click on the chart to select it. Green sizing handles appear around the chart.
- Hover the mouse pointer anywhere over the chart. When it changes shape, click and drag the chart to its new location.
- Release the mouse button when the element is in the desired position.
To resize or move a chart using the Position and Size dialog box:
- Click on the chart to select it. Green sizing handles appear around the chart.
- Choose Format > Position and Size from the menu bar, or right-click and choose Position and Size from the pop-up menu, or press F4. For more about the use of this dialog box, see Chapter 6 (Formatting Graphic Objects).
Moving chart elements
You may wish to move or resize individual elements of a chart, independent of other chart elements. For example, you may wish to move the legend to a different place. Pie charts allow moving of individual wedges of the pie (in addition to the choice of “exploding” the entire pie).
- Double-click the chart so that is enclosed by a gray border.
- Click any of the elements—the title, the legend, or the chart graphic—to select it. Green resizing handles appear.
- Move the pointer over the selected element. When it changes shape, click and drag to move the element.
- Release the mouse button when the element is in the desired position.
|
| If your graphic is 3D, round red handles appear which control the three-dimensional angle of the graphic. You cannot resize or reposition the graphic while the round red handles are showing. With the round red handles showing, Shift + Click to get the green resizing handles. You can now resize and reposition your 3D chart graphic. See the following tip.
|
 | You can resize the chart graphic using its green resizing handles (Shift + Click, then drag a corner handle to maintain the proportions). However, you cannot resize the title or the key.
|
Changing the chart area background
- The chart area is the area surrounding the chart graphic, including the (optional) main title and key.
- Double-click the chart so that it is enclosed by a gray border.
- Select Format > Chart Area. The Chart Area window appears.
- Choose the desired format settings.
Changing the chart graphic background
The chart wall is the area that contains the chart graphic.
- Double-click the chart so that it is enclosed by a gray border.
- Select Format > Chart Wall. The Chart Wall window appears. It has the same formatting options as described in
Changing the chart area background.
- Choose your settings and click OK.
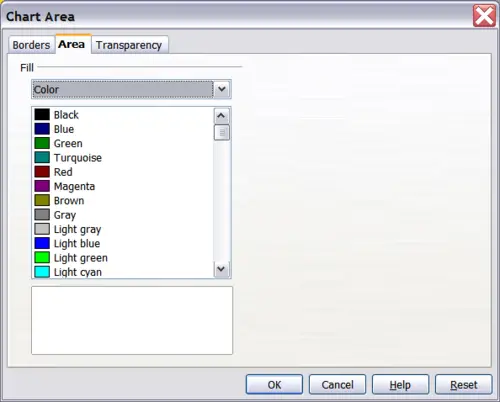
Chart Area dialog box


