|
 |
|
| |
Entering chart data
Opening a chart data window
- If the chart is not already in edit mode (with a gray border), double-click it. The main toolbar now shows tools specifically for charts. (If the main toolbar is not showing, select View > Toolbars > Main Toolbar.)
- Click the Chart Data icon
 or select View > Chart Data Table, or right-click on the chart and choose Chart Data Table. The Data Table dialog box appears. or select View > Chart Data Table, or right-click on the chart and choose Chart Data Table. The Data Table dialog box appears.
 | If you drag the Data Table dialog box so that your chart is visible, you can then immediately see the results of each change after clicking in a different cell.
|
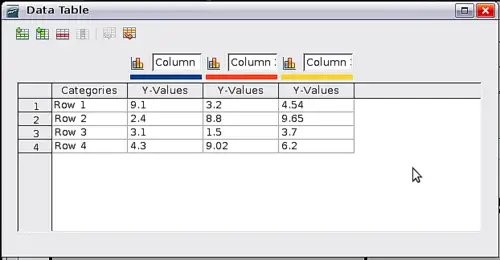 Data Table dialog box Entering data
Enter data in the Data Table dialog box.
- Insert buttons insert a row or column.
- Delete buttons remove the information from a selected row or column.
- Move buttons move the contents of the selected column to the right, or move the contents of the selected row down.
- Input fields and cells are where you insert data. Type or paste information into the boxes within the desired rows and columns.
|
|
|


