Drill (show details)
With a drill you can show for the single, compressed values in the DataPilot result the related detailed data. You can activate a drill through a double-click on the cell or use Data > Group and Outline > Show Details. You have to distinguish two cases:
- The active cell is the category of a row or column field.
In this case drill means an additional breakdown into the categories of another field.
For example, double-click on the cell with the value golfing in the row field region. In this case the values that are aggregated in the category golfing are subdivided according to another field.
Since there are more possibilities for a subdivision, a dialog appears where you can make your needed settings.
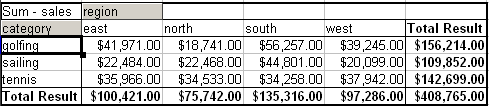
Before the drill down for the category golfing
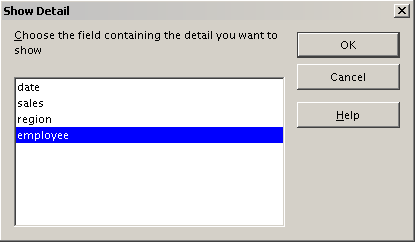
Selection of the field for the subdivision
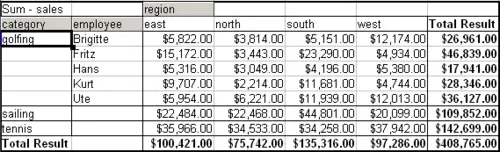
After the drill down
To hide the details again, double-click on the cell golfing or choose Data > Group and Outline > Hide Details.
The DataPilot remembers your selection (in our example the field employee), so that for the next drill down for a category in the field region the dialog does not appear. To remove the selection employee, open the DataPilot dialog by right-clicking and choosing Start, then delete the unwanted selection in the row or column field.
- The active cell is a value of the data field.
In this case drilldown means a listing of all data entries of the data source that aggregates to this value.
Double-click on the cell with the value $18,741 and you'll get a list of all data sets that are included in this value. This list is shown in an new sheet.
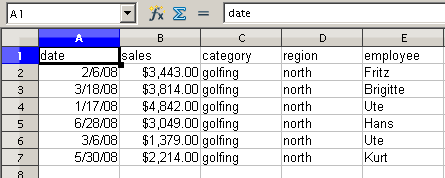
New table sheet after the drilldown for a value in a data field.


