Line charts
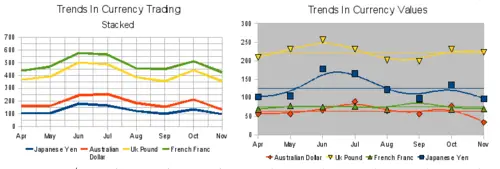
A line chart is a time series with a progression. It is ideal for raw data, and useful for charts with plentiful data that shows trends or changes over time where you want to emphasize continuity. On line charts, the x-axis is ideal to represent time series data.
Things to do with lines: thicken them up, make them 3D, smooth the contours, just use points.
3D lines confuse the viewer, so just using a thicker line often works better.
Line charts


