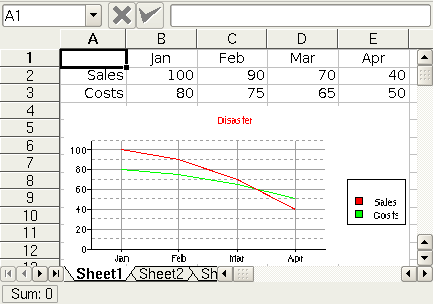
You can insert a chart into a sheet to give a graphical view of your
data.
First select the area of cells containing the data and choose
->
. The cursor will change to a small cross shape which you
should drag across the sheet while holding the left
mouse button down to define the area where you want the
chart to appear, there is no need to be too accurate at this stage as the
chart size can easily be changed at any time. When you release the mouse
button a chart wizard dialog box will appear.
The wizard allows you to define the type of chart, labels and legend
that you need. You may wish to refer to the KChart Handbook at this stage,
but again if you make a wrong choice you can correct it later.
When you press the
Finish
button the wizard will
vanish and you will see the chart embedded into the worksheet.
To move, resize or even delete the embedded chart click anywhere
within the chart area. It should now appear with a diagonal hatch border
and with a small black square at each corner and in the middle of each edge.
If you move the cursor over any of the black squares it should change
to a double headed arrow. You can resize the chart by dragging one of these
squares with the left mouse button pressed. To
delete the chart right click on one of the
squares and select
.
To move the chart move the cursor so that it is over one of the
hatched borders. The cursor should then change to a hand, press the
left mouse button and you will be able to drag the
chart to where you want it to be.
To restore the chart to its normal appearance simply click anywhere
outside of the chart area.
To change the format of the chart itself left
click twice within the chart area. It should then appear with a diagonal
hatch border without any small black squares and KChart's
Chart Toolbar
should appear in KSpread's window. You can then
use these KChart tools or a selection from the menu that pops up when you
right click in the chart area to change the chart.