|
 |
|
| |
Tips and Tricks (JDT)
The following tips and tricks give some helpful ideas for increasing your productivity.
See also
Platform Tips and Tricks
for general Eclipse tips and
What's New in 3.5 (JDT) for
features in this release.
Editing |
Refactoring |
Navigation |
Searching |
Views |
Miscellaneous |
Debugging
Editing source
|
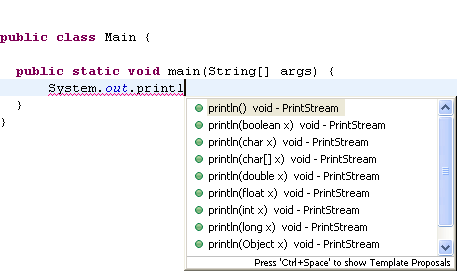
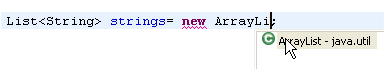
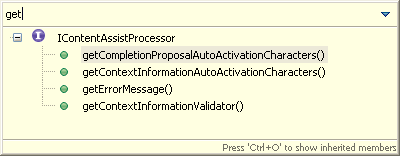
Content assist
|
Content assist provides you
with a list of suggested completions for partially entered strings.
In the Java editor press Ctrl+Space or use Edit >
Content Assist.
|
|
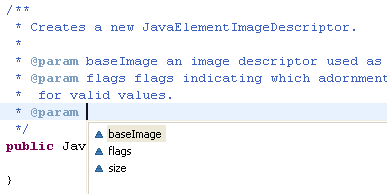
Content assist in
Javadoc comments
|
Content assist is also
available in Javadoc comments.
|
|
Content assist for static imports
|
To get content assist proposals for static members
configure your list of favorite static members on the
 Java > Editor > Content Assist > Favorites
preference page.
Java > Editor > Content Assist > Favorites
preference page.
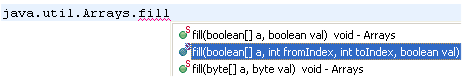
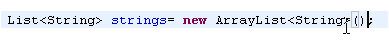
For example, if you have added java.util.Arrays.* to
this list, then all static methods of this type matching the completion
prefix will be added to the proposals list:
|
|
Suppress types in content
assist
|
To exclude certain types from appearing in content assist, use the type
filter feature configured on the
Java > Appearance > Type Filters
preference page. Types matching one of these filter patterns
will not appear in the Open Type dialog and will not be available to
content assist, quick fix and organize imports. These filter patterns
do not affect the Package Explorer and Hierarchy views.
|
|
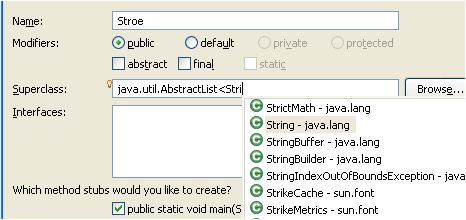
Content assist for
variable, method parameter and field name completions
|
You can use content assist to speed up the creation of fields, method
parameters and local variables. With the cursor positioned after the
type name of the declaration, press Ctrl+Space or use Edit > Content Assist.
If you use a name prefix or suffix for fields, local variables or
method parameters, be sure to specify this in the
Java > Code Style
preference page.
|
|
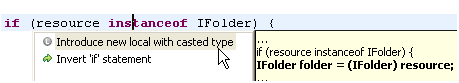
Content assist for variable with unresolved type
|
Code assist also works on accesses to
types that are not imported yet. Depending on the
Java > Editor > Content Assist
> Add import instead of qualified name preference the editor
will either automatically add imports or fully qualify the types for such
proposals.
Pressing ; in the following scenario:

results in:

|
|
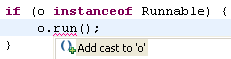
Content assist after instanceof condition
|
Content assist can propose members
available on types used in instanceof conditions.

Eclipse will add the required cast for you when you select such a proposal.
|
|
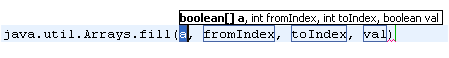
Parameter hints
|
With the cursor in a method
argument, you can see a list of parameter hints. In the Java Editor
press Ctrl+Shift+Space or invoke Edit > Content Assist > Parameter Hints.
|
|
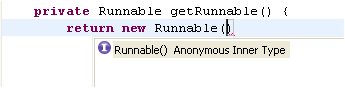
Content assist on
anonymous classes
|
Content assist also
provides help when creating an anonymous class. With the cursor
positioned after "new " and the beginning of an abstract class or interface name
press Ctrl+Space or invoke Edit > Content Assist > Default.
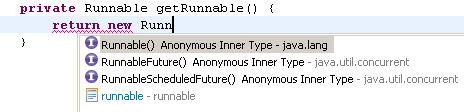
This will create the body of the anonymous inner class including all
methods that need to be implemented.
This also works if you place the caret after the opening parentheses of a class instance creation:
|
|
Toggle between
inserting and replacing content assist
|
When content assist is invoked
on an existing identifier, it can either replace the
identifier with the chosen completion or do an insert. The
default behavior (overwrite or insert) is defined in the
Java > Editor > Content Assist
preference page.
You can temporarily toggle the behavior while inside the content
assist selection dialog by pressing and holding the Ctrl key while
selecting the completion. |
|
Incremental content assist
|
Content assist can also Insert common prefixes automatically, similar to
Unix shell expansion. To enable that behavior, select the check box on the
Java > Editor > Content Assist
preference page.
|
|
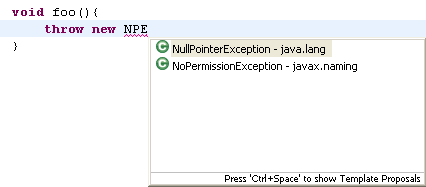
Camel case support in code completion
|
Code completion supports camel case patterns.
For example, completing on NPE or NuPoiE will propose NullPointerException.
This support can be disabled using the Show camel case matches
Java > Editor > Content Assist
preference page.
|
|
Customize content assist categories
|
Repeatedly invoking content assist (Ctrl+Space) cycles through different proposal
categories.
To configure which categories to show use the
Java > Editor > Content Assist > Advanced
preference page.
You can also assign separate key shortcuts to your favorite proposal categories.
|
|
Create getters and
setters
|
To create getter and setter
methods for a field, select the field's declaration and invoke Source
> Generate Getter and Setter.
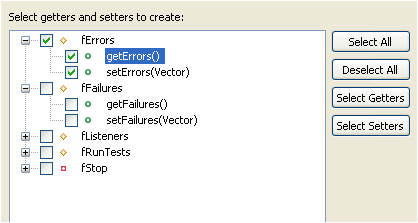
If you use a name prefix or suffix be sure to specify this in the
Java > Code Style
preference page. |
|
Create getters and setters quick assist
|
A quick assist (Ctrl+1) is available on fields to
create getters and setters.

|
|
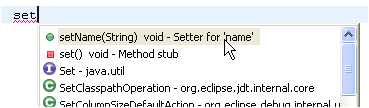
Use content assist to
create getter and setters
|
Another way to create
getters and setters is using content assist. Set the cursor in the
type body between members and press Ctrl+Space to get the proposals
that create a getter or setter method stub.
|
|
Delete getters and
setters together with a field
|
When you delete a field
from within a view,
Eclipse can propose deleting its Getter and Setter methods.
If you use a name prefix or suffix for fields, be sure to specify this in the
Java > Code Style
preference page. |
|
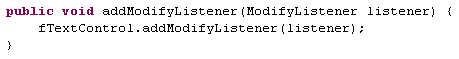
Create delegate methods
|
To create a delegate method
for a field select the field's declaration and invoke Source >
Generate Delegate Methods. This adds the selected methods
to the type that contains a forward call to delegated methods. This
is an example of a delegate method:
|
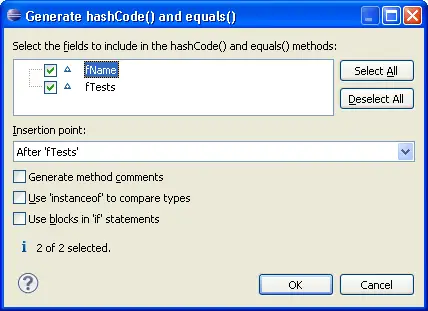
Create hashCode() and equals()
|
To create the methods hashCode() and equals()
invoke Source > Generate hashCode() and equals().
|
|
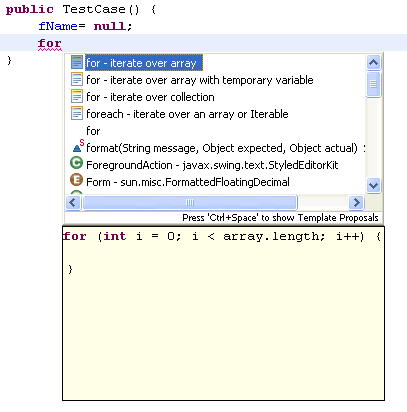
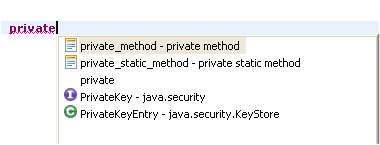
Use templates to create
a method
|
Templates are shown together with the Content
Assist (Ctrl+Space) proposals.
There are existing templates, such as 'private_method',
'public_method', 'protected_method' and more, but you can also
define new templates for method stubs.
After applying a template, use the Tab key to navigate among the values to enter
(return type, name and arguments).
|
|
Use templates to create
SWT widgets
|
On projects which have the SWT library on the classpath,
you can create SWT widgets with Content Assist (Ctrl+Space)
To add, for example, an SWT button, type Button and press Ctrl+Space,
select the Button SWT template, and press Enter.
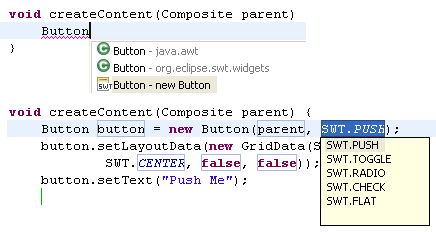
To see all available templates go to the
Java > Editor > Templates
preference page or open the Templates view through Window > Show View > Other....
|
|
Create your own
templates
|
To create your own templates, go to the
Java > Editor > Templates
preference page and press the New button to
create a template. For example, a template to iterate backwards in an
array would look like this:
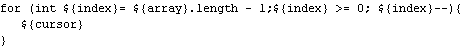
|
|
Use Quick Fix to create
a new method
|
Start with the method
invocation and use Quick Fix (Ctrl+1) to create the method.
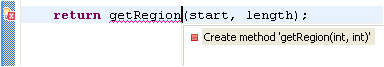
|
|
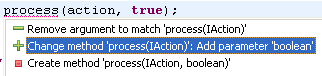
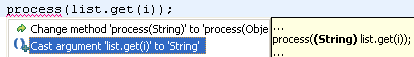
Use Quick Fix to change
a method signature
|
Add an argument to a method
invocation at a call site. Then use Quick Fix (Ctrl+1) to add the
required parameter in the method declaration.
|
|
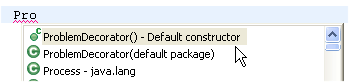
Use content assist to
create a constructor stub
|
At the location where you
want to add the new constructor, use content assist after typing the
first letters of the constructor name.
|
|
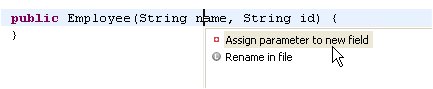
Create new fields from
parameters
|
Do you need to create new
fields to store the arguments passed in the constructor? Use Quick
Assist (Ctrl+1) on a parameter to create the assignment and the
field declaration and let Eclipse propose a name according to your Code
Style preferences.
|
|
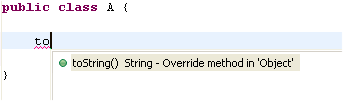
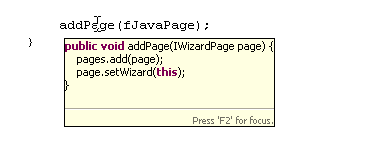
Use content assist to
override a method
|
Invoke Content Assist
(Ctrl+Space) in the type body at the location where the method
should be added. Content assist will offer all methods that can be
overridden. A method body for the chosen method will be created.
|
|
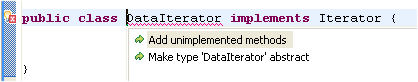
Use Quick Fix to add
unimplemented methods
|
To implement a new
interface, add the 'implements' declaration first to the type.
Even without saving or building, the Java editor will underline the
type to signal that methods are missing and will show the Quick Fix
light bulb. Click on the light bulb or press Ctrl+1 (Edit >
Quick Fix) to choose between adding the unimplemented methods or
making your class abstract.
|
|
Use Clean Up to add
unimplemented methods
|
When you add a new method to
an interface or an abstract method to an abstract class, Eclipse can generate
method stubs in all concrete subclasses at once. Invoke Source > Clean Up...
on a set of Java elements, use a custom profile, and select on the Configure...
dialog to Add unimplemented methods on the Missing Code tab.
|
|
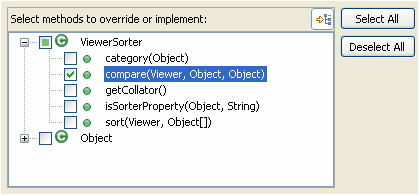
Override a method
from a base class
|
To create a method that
overrides a method from a base class:
Select the type where the methods should be added and invoke Source >
Override/Implement Methods. This opens a dialog that lets you
choose which methods to override.
|
|
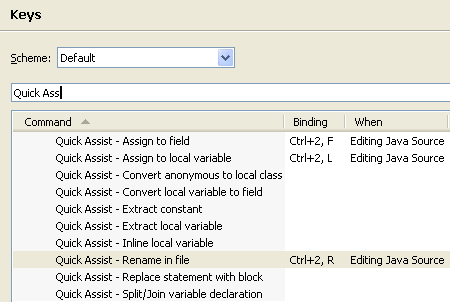
Rename in file
|
To quickly do a rename that
doesn't require full analysis of dependencies in other files, use the
'Rename in file' Quick Assist. In the Java Editor, position the
cursor in an identifier of a variable, method or type and press Ctrl+1
(Edit > Quick Fix)
The editor is switched to the linked edit mode (like templates) and
changing the identifier simultaneously changes all other references
to that variable, method or type.
You can also use the direct shortcut Ctrl+2 R. Use the
General > Keys
preference page
to configure shortcuts (in the 'Source' category).
|
|
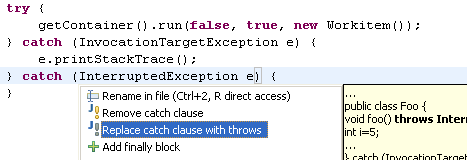
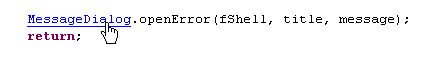
Use Quick Fix to handle
exceptions
|
Dealing with thrown exceptions is
easy. Unhandled exceptions are detected while typing and marked with
a red line in the editor.
- Click on the light bulb or press Ctrl+1 to surround the
call with a try catch block. If you want to include more statements
in the try block, select the statements and use Source >
Surround With > Try/catch Block. You can also select individual
statements by using Edit > Expand Selection To and
selecting Enclosing, Next or Previous.
- If the call is already surrounded with a try block, Quick Fix
will suggest adding the catch block to the existing block.
- If you don't want to handle the exception, let Quick Fix add a
new thrown exception to the enclosing method declaration
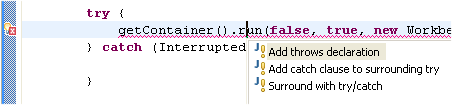
At any time, you can convert a catch block to a thrown exception. Use
Ctrl+1 (Edit > Quick Fix) on a catch block.
|
|
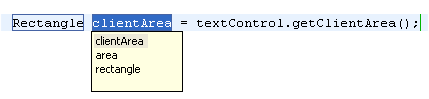
Less typing for
assignments
|
Instead of typing an assignment, start
with the expression that will be assigned.
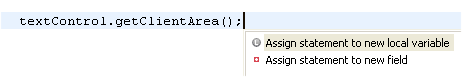
Now use Ctrl+1 (Edit > Quick Fix) and choose 'Assign
statement to new local variable' and Quick Assist will guess a
variable name for you.
|
|
Less work with cast
expressions
|
Don't spend too much time with typing casts. Ignore them first and use quick assist to add them after
finishing the statement.
For example on assignments:
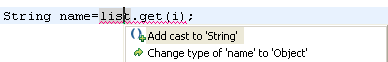
Or for method arguments:
Or for method call targets:
|
Assign a casted
expression
|
After an 'instanceof' check, it is very common to cast the expression and assign it to a new local variable. Invoke Quick
Assist (Ctrl+1) on the 'instanceof' keyword to save yourself some typing:
|
|
Surround lines
|
To surround statements with an if /
while / for statement or a block, select the lines to surround and
invoke Source > Surround With or press Alt+Shift+Z.
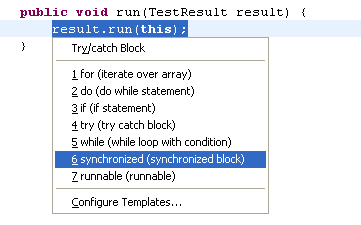
The entries in the menu are derived from the normal editor templates: All
templates that contain the variable ${line_selection} will show up in the menu.
Templates can be configured on the
Java > Editor > Templates
preference page. Edit the corresponding templates to customize the resulting code or
define your own surround-with templates.
|
More Quick Assists and Fixes
|
Check out the Quick Assist page for a complete list of available code transformations. A list of quick fixes can be found here.
|
Shortcuts for Quick Fixes and Assists
|
Some of the popular quick assists like
Rename in file and Assign to local variable can be invoked
directly with Ctrl+2 R and Ctrl+2 L. Check
the
General > Keys
preference page for more quick fixes and quick assists that support direct
invocation.
Type "Quick Assist" or "Quick Fix" in the filter field:
|
|
Content assist can insert
argument names automatically
|
You can have content assist insert argument names automatically on
method completion. This behavior can be customized on the
Java > Editor > Content Assist
preference page (see the
Fill method arguments and show guessed arguments checkbox.) For example, when
you select the second entry here,
content assist will automatically insert argument names:
You can then use the Tab key to navigate between the
inserted names.
If you choose Insert best guessed arguments, the best guess will be filled in by default. The alternative
proposals are still available.
|
Automatically insert
type arguments
|
Enabling Fill method arguments and show guessed arguments on the
Java > Editor > Content Assist
preference page
is also useful when working with parameterized types in J2SE 5.0.
results in:
|
|
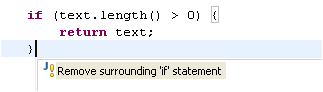
Remove surrounding
statement
|
To remove a surrounding statement or
block, position the cursor at the opening or closing bracket and press Ctrl+1
(Edit > Quick Fix).
|
|
How was that word spelled again?
|
You can enable spell-checking support in the Java editor on the
General > Editors > Text Editors > Spelling
preference page. Spelling errors
are displayed in the Java editor and corresponding Quick Fixes are available:

You can make the
dictionary also available to the content assist. A Quick Fix allows you to
add new words to the user dictionary on the fly.
|
|
Structured selections
|
The Structured Selection actions can be used to
enlarge the current selection to the next enclosing element:
Highlight some text and press Alt+Shift+Arrow Up or select Edit
> Expand Selection To > Enclosing Element from the menu
bar - the selection will be expanded to the smallest Java-syntax
element that contains the selection. You can then further expand the
selection by invoking the action again (or other actions from the Expand Selection To menu).
This is for example helpful to select the enclosing identifier for renames,
or the select adjacent statements for a subsequent Extract Method refactoring.
|
|
Find the matching
bracket
|
To find a matching bracket select an
opening or closing bracket and press Ctrl+Shift+P or select Navigate >
Go To > Matching Bracket. You can also double click
before an opening or after a closing bracket - this selects the text
between the two brackets.
|
|
Smart Javadoc
|
Type '/**' and press Enter. This
automatically adds a Javadoc comment stub containing the standard
@param, @return and @exception tags.
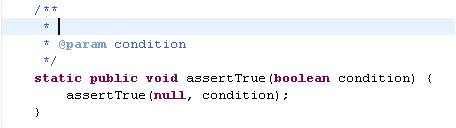
The templates for the new comment can be configured in the
Java > Code Style > Code Templates
preference page.
|
|
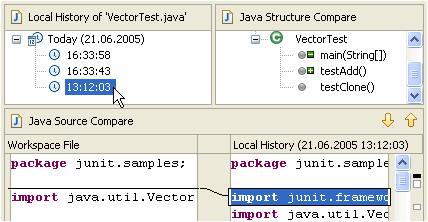
Use the local history
to revert back to a previous edition of a method
|
Whenever you edit a file,
its previous contents are kept in the local history. Java tooling
makes the local history available for Java elements, so you can
revert back to a previous edition of a single method instead of the
full file.
Select an element (e.g. in the Outline view) and use Replace With > Local History
to revert back to a previous edition of the element.
|
|
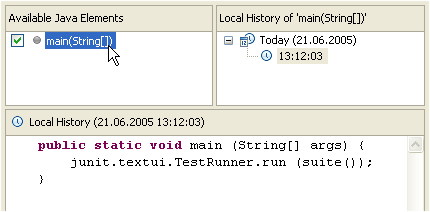
Use the local history
to restore removed methods
|
Whenever you edit a file,
its previous contents are kept in the local history. Java tooling
makes the local history available for Java elements, so you can
restore deleted methods selectively.
Select a container (e.g. in the Outline view) and use Restore from Local History to
restore any removed members.
|
|
Customizable code
generation
|
The
Java > Code Style > Code Templates
preference page
allows you to customize
generated code and comments in a similar way to normal templates.
These code templates are used whenever code is generated.
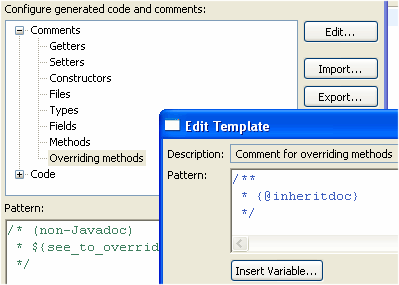
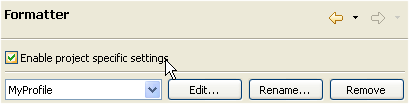
Since 3.1, it is possible to use project specific Code templates, that will also be shared in the team if your project is shared. Open the Properties on a project to enable project specific settings.
|
|
Create comments in your
code
|
Comments can be added explicitly with Source > Generate Element Comment (Alt+Shift+J) or automatically by various wizards, refactorings or quick fixes.
Configure the comment templates on the
Java > Code Style > Code Templates
preference page.
Enable or disable the automatic generation of comments either directly on the wizard (e.g. using 'Generate
Comment' checkbox on the new Java type wizards) or by the 'Automatically
add new comments for new methods and types' checkbox of the
Java > Code Style > Code Templates
preference page.
All these settings can also be configured on a per project basis. Open the Properties on a project to enable project specific settings. |
|
Sort members
|
You can Sort Members
of a Java compilation unit or a set of compilation units according to a category order defined in the
Java > Appearance > Members Sort Order
preference page.
You'll find the action under Source > Sort Members. |
|
Wrap strings
|
You can have String literals wrapped when you edit them. For
example, if you have code like this:
String message= "This is a very long message.";
position your caret after the word "very" and press Enter.
The code will be automatically changed to:
String message= "This is a very" +
           " long message.";
This behavior can be customized in the
Java > Editor > Typing
preference page.
|
|
Smart Typing and how to control it
|
The Java editor's Smart Typing features ease your daily work. You can configure
them on the
Java > Editor > Typing
preference page.

When you enable Automatically insert Semicolons at correct
position, typing a semicolon automatically positions the cursor at the end of the statement before inserting the semicolon. This safes you some additional cursor navigation.
You can
undo this automatic positioning by pressing backspace right afterwards.
|
|
Fix your code
indentation with one key stroke
|
A useful feature is Source
> Correct Indentation or Ctrl+I.
Select the code where the indents are incorrect and invoke the action.
If nothing is selected, the action indents the current line.
|
|
Fix your code
indentation on save
|
Eclipse can correct the indentation
of your code when you save the editor. Go to the
Java > Editor > Save Actions
preference page and
Configure... Additional actions, and select to Correct indentation on
the Code Organizing tab.
|
|
Quick menus for source and
refactoring actions
|
The refactoring and source actions can be accessed via a quick
menu. Select the element to be manipulated in the Java editor or in a
Java view and press Alt+Shift+S for the quick source menu,
Alt+Shift+T for the quick refactoring menu and Alt+Shift+Z for the surround with menu.
|
|
Find unused code
|
The Java compiler detects
unreachable code, unused variables, parameters, imports and unused
private types, methods and fields.
Change the settings for the detection on the
Java > Compiler > Error/Warnings
preference page. These settings can also be specified per project, use: Project > Properties > Java Compiler >
Error/Warnings.
These problems are detected as you type, and a quick fix is
offered to remove the unneeded code.
You can also use Source > Clean Up... to remove unused code. |
|
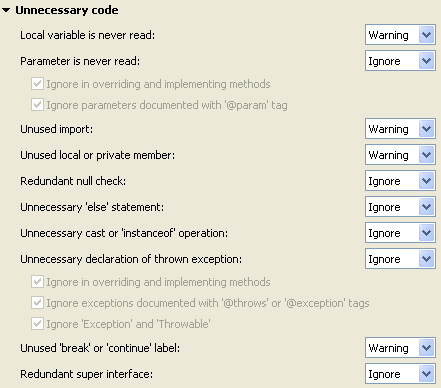
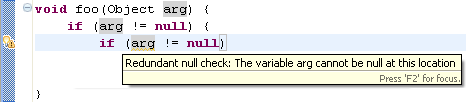
Find problems with null
|
The compiler can help you find problems with null in your code.
The
Java > Compiler > Errors/Warnings
preference page has three options to detect problems:
-
Null pointer access (in 'Potential programming problems')
When this option is enabled, the compiler will issue an error or warning
whenever a variable that is statically known to hold a null value
is used to access a field or method, as shown in the example below:
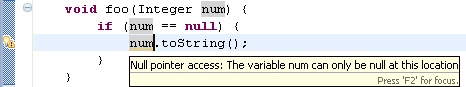
-
Potential null pointer access (in 'Potential programming problems')
When this option is enabled, the compiler will issue an error or a
warning whenever a variable is statically known to potentially hold
a null value, as shown in the example below:
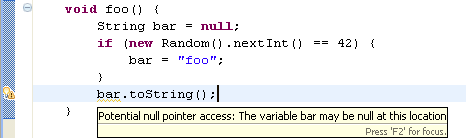
-
Redundant null check (in 'Unnecessary code')
When enabled, the compiler will issue an error or a warning whenever
a variable that is statically known to hold a null or a non-null
value is tested against null, as shown in the examples below:
|
|
Change problem severity in problem hover
|
When a problem hover has been enriched
(by pressing F2 or moving the mouse into the hover),
an action to change the severity of the current problem is available.
Click on the button in the toolbar to go to the
Java > Compiler > Errors/Warnings
preference page.
|
|
Javadoc comment handling
|
The Eclipse Java compiler can process Javadoc comments. Search
reports references in doc comments, and refactoring updates these
references as well. This feature is controlled from the
Java > Compiler > Javadoc
preference page (or set for an individual
project using Project > Properties > Java Compiler >
Javadoc).
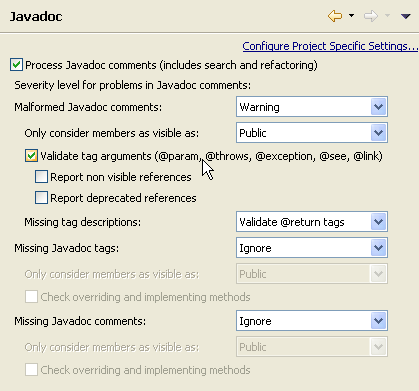
When turned on, malformed Javadoc comments are marked in the Java editor and can be fixed using Edit
> Quick Fix (Ctrl+1):

|
|
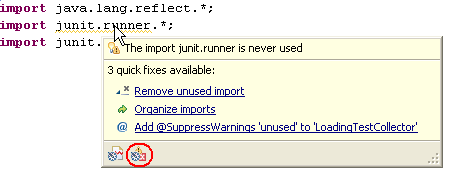
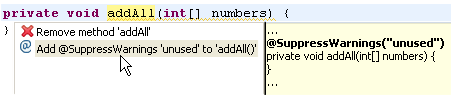
Suppress warnings
|
In J2SE 5.0 and later, you can suppress all optional compiler warnings using the SuppressWarnings annotation.
In this example, addAll() is marked as an unused method. Quick Fix (Ctrl+1) is used to add a SuppressWarnings annotation so that the warning will not be shown for this method.
|
|
Clean Ups
|
Source > Clean Up... helps fixing multiple
problems at once and helps to establish a consistent code style. For instance, you can:
- convert all
for loops to enhanced for
loops where possible.
- mark all overriding methods in a whole project with an
@Override annotation.
- organize imports
- format your code
- remove unnecessary code
Clean Ups are organized in Clean Up profiles.
A profile can be attached to the workspace or to individual projects.
Project settings can be shared in a team through a version control system.
It is also possible to export and import each profile.
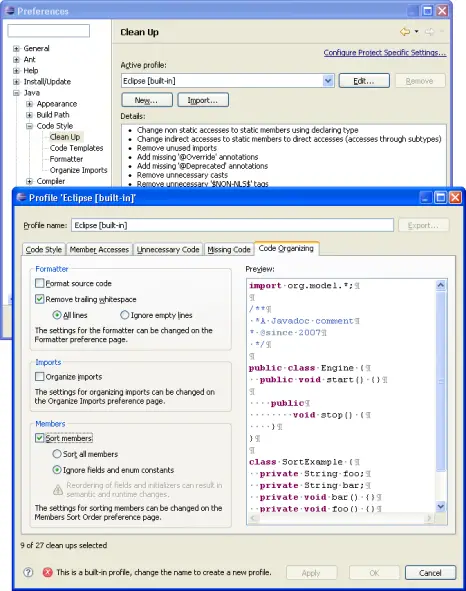
Clean Ups can be executed as save actions on save. Go to the
Java > Editor > Save Actions
preference page to configure
which clean ups to invoke on save.
|
Refactoring
|
Scripting of refactorings
|
Most of the refactorings offered by JDT can not only be executed interactively, but also by a refactoring script.
Create a refactoring script from the refactoring history using Refactor > Create Script....
A refactoring script
can then be applied later on an arbitrary workspace using Refactor > Apply Script....
Such refactoring scripts can be used in different scenarios such as automatic fixing of breaking API changes between software layers
or providing patches with rich semantics.
|
|
Safe JAR file migration
|
When exporting a JAR file from the workspace, the JAR Export Wizard offers the option
to include refactoring information into the JAR file.
Use File > Export... and select JAR file. On the first page of the JAR Export Wizard, select
Export refactorings for checked projects. Click on the link to select the refactorings to include.
Clients are then able to migrate an old version of the JAR file to a new one using the Refactor > Migrate JAR File... refactoring. This refactoring
automatically updates all code which is dependent on the old version of the JAR file to use the new version of the JAR file.
|
Searching
|
Locate variables and
their read/write access
|
You can locate variables
and see their read/write status by selecting an identifier
(variable, method or type reference or declaration) and invoking Search
> Occurrences in File > Identifier. This marks all references of this
identifier in the same file. The results are also shown in the search
view with different colors for read or write access, along with icons
showing the variable's read or write access.
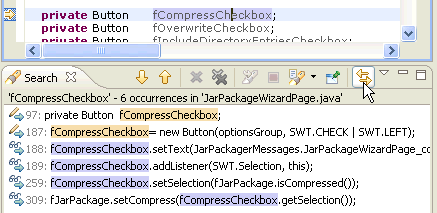
Alternatively, use the
Mark
Occurrences
feature to dynamically highlight occurrences.
You can search over several files by using the general search
features (Search > References).
|
|
Search for methods with
a specific return type
|
To search for methods with a specific return type, use "*
<return type>" as follows:
- Open the search dialog and click on the Java Search tab.
- Type '*' and the return type, separated by a space, in the Search
string.
- Select the Case sensitive checkbox.
- Select Method and Declarations and then click Search.
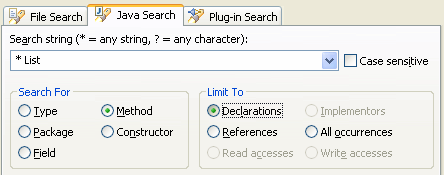
|
|
Filter search matches in Javadoc
|
By default, Java Search finds references inside
Java code and Javadoc. If you don't want to see the references inside Javadoc, you can filter these
matches by enabling 'Filter Javadoc' in the view menu (triangle symbol) of the search view. |
|
Filter potential search matches
|
Potential matches occur when a compile-time problem
prevents the search engine from completely resolving the match. Filter these matches with Filter Potential
in the search view menu (triangle symbol). |
|
Trace method call chains
with the Call Hierarchy
|
Use the Call Hierarchy to follow long or complex
call chains without losing the original context: Just select a method
and invoke Navigate > Open Call Hierarchy (Ctrl+Alt+H).
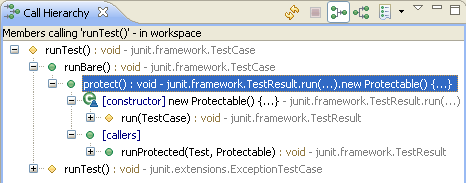
Methods from anonymous classes or special types like Runnable are
by default expanded with constructors, since it is often more interesting to
see where the object is created than where the method is invoked.
Expand with Constructors from the context menu toggles this behavior. The defaults can
be configured in the view menu.
|
Code navigation and reading
|
Open selection in
Java editor
|
There are two ways how you
can open an element from a reference in the Java editor.
- Select the reference in the code and press F3 (Navigate >
Open Declaration)
- Hold Ctrl, move the mouse pointer over the reference, and click the hyperlink
Holding Ctrl on an overridable method shows a popup with an Open Implementation entry, which directly
opens the implementation in case there's only one, or shows all the concrete implementations for that method
in the hierarchy of its declaring type, using the quick type hierarchy.
The hyperlink style navigation can be configured on the
General > Editors > Text Editors > Hyperlinking
preference page.
|
|
In-place outlines
|
Press Ctrl+F3 in the
Java editor to pop up an in-place outline of the element at the
current cursor position. Or press Ctrl+O (Navigate > Quick
Outline) to pop up an in-place outline of the current source
file.
|
|
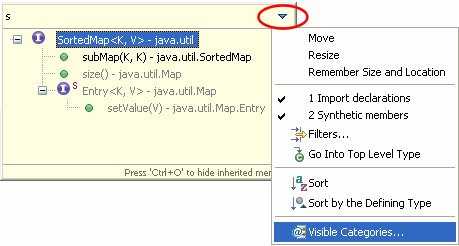
In-place outlines show inherited members
|
Press Ctrl+O or Ctrl+F3
again to add inherited members to an open In-place outline. Inherited members have a gray label.
Filter and sort the outline with the menu in the upper right corner.
|
|
In-place hierarchy
|
Find out which are the
possible receivers of a virtual call using the Quick Type Hierarchy.
Place the cursor inside the method call and press
Ctrl+T (Navigate > Quick Type Hierarchy).
The view shows all types that implement the method with a full icon.
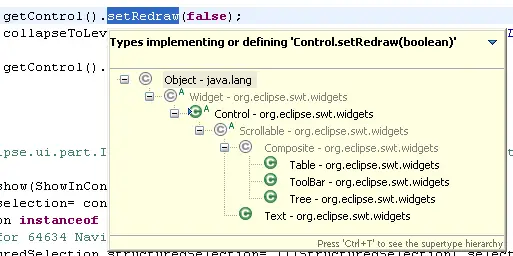
Press Enter to open the corresponding method in an editor. Press Ctrl+T again to switch
to the Supertype hierarchy.
|
|
Java Editor Breadcrumb
|
The Java Editor contains a breadcrumb navigation bar which
shows the path to the element at the cursor position. The breadcrumb can be enabled via
the Toggle Breadcrumb tool bar button or by pressing Alt+Shift+B.
Each element in the breadcrumb can be selected and actions can be invoked through a
context menu or keyboard short cuts. Furthermore the breadcrumb lets you navigate to other
elements via drop-downs.
|
|
Advanced highlighting
|
The Java editor can highlight source code according to its
semantics (for example: static fields, local variables, static method
invocations). Have a look at the various options on the
Java > Editor > Syntax Coloring
preference page.

|
|
Initially folded regions
|
You can specify which regions are folded by default when an editor is opened. Have a look at the
Java > Editor > Folding
preference page to customize this.

|
|
Mark occurrences
|
When working in the
editor, turn on Mark Occurrences in the toolbar ( ) or
press Alt+Shift+O. You'll see within a file, where a
variable, method or type is referenced.
) or
press Alt+Shift+O. You'll see within a file, where a
variable, method or type is referenced.
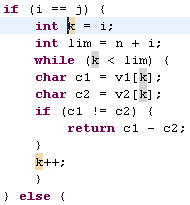
Different colors are used to mark read and write accesses.
Selecting a return type shows you the method's exit points. Select an
exception to see where it is thrown.
Select a super class or interface to see the methods override or implement a method from the selected super type.
Fine tune 'mark occurrences' on the
Java > Editor > Mark Occurrences
preference page.
Change the color for to marker on the
General > Editors > Text Editors > Annotations
preference page.
To show occurrences in the Search view, use the
Search > Occurrences
feature.
|
|
Go to next / previous
method
|
To quickly navigate to the
next or previous method or field, use
Ctrl+Shift+Arrow Up (Navigate > Go To > Previous Member)
or Ctrl+Shift+Arrow Down (Navigate > Go To > Next Member)
|
|
Control your navigation between annotations
|
Use the Next / Previous Annotation toolbar buttons or Navigate
> Next Annotation (Ctrl+.) and Navigate > Previous
Annotation (Ctrl+,) to navigate between annotations
in a Java source file.
With the button drop-down menus, you can configure on which annotations you want to stop:

|
|
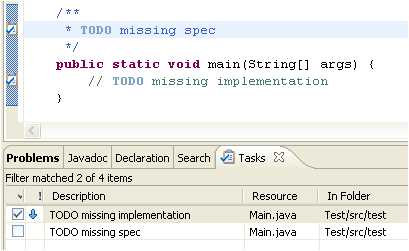
Reminders in your Java
code
|
When you tag a comment in
Java source code with "TODO" the Java compiler automatically creates
a corresponding task as a reminder. Opening the task navigates you
back to the "TODO" in the code. Use the
Java > Compiler > Task Tags
preference page to configure any other special tags (like "FIXME") that you'd
like to track in the task list.
|
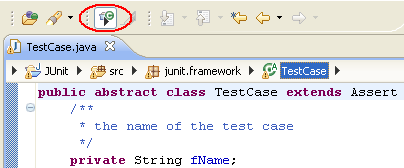
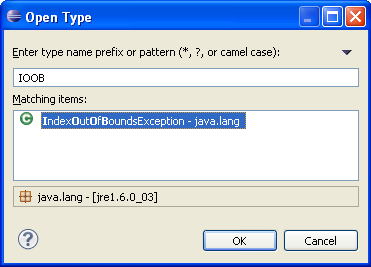
Tricks in the Open Type dialog
|
The Open Type dialog (Navigate > Open Type or toolbar button) helps you navigate to a type
by its name.
- To find types quickly, only type the capital letters of the type name:
IOOBE finds IndexOutOfBoundsException.
Or type the first few characters of each name part:
NuPoiE finds NullPointerException.
- To see all types ending with a given suffix, e.g. all Tests, use *Test<
to not see all types containing Test somewhere else in the type name.
- To open multiple types at once, select them in the list and click OK.
|
|
Make hovers sticky
|
You can open the text from
a hover in a scrollable window by pressing F2 (Edit > Show
Tooltip Description) or by moving your mouse pointer into the hover. You can select and copy content from this
window, invoke actions, or follow links.
You can configure how to enrich the hover on the
General > Editors > Text Editors
preference page.
|
|
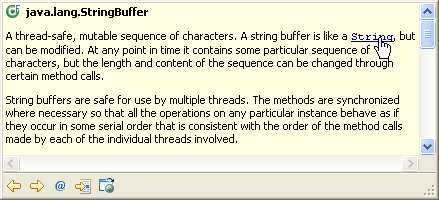
Hovers in the Java
editor
|
You can see different hovers in the
Java editor by using the
modifier keys (Shift, Ctrl, Alt).
When you move the mouse over an identifier that has no warning or problem annotation in the Java editor, by
default a hover with the Javadoc extracted from the corresponding
source of this element is shown. If there's a problem annotation on the identifier then the hover
shows the corresponding message. Holding down the Shift key shows you
the source code:
You can change this behavior and define the hovers for other modifier
keys in the
Java > Editor > Hovers
preference page.
|
Generic method inferred signature
|
You can use hover to show the inferred signature of a generic method.
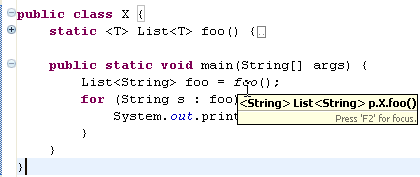
|
|
Open and configure
external Javadoc documentation
|
If you want to open the
Javadoc documentation for a type, method or field with Shift+F2
(Navigate > Open External Javadoc), you first have to specify
the documentation locations to the elements parent library (JAR,
class folder) or project (source folder).
For libraries, open the build path page (Project > Properties
> Java Build Path), go to the Libraries, and expand the
node of the library where you can edit the 'Javadoc location' node.
The documentation can be local on your file system in a folder or
archive, or on a web server.
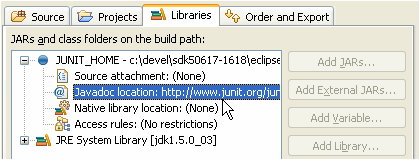
For types, methods or fields in source folders, go to the (Project
> Properties > Javadoc Location). |
Java views
|
Organizing workspace with many projects
|
Use Top Level Elements > Working Sets in the Package Explorer's view menu to enable
a new mode that shows working sets as top level elements. This mode makes it
much easier to manage workspaces containing lots of projects.
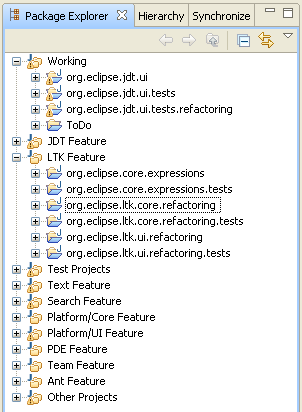
Use Configure Working Sets... from the Package Explorer's view
menu to configure which working sets get shown. The dialog lets you
create new Java working sets, define which working sets are shown and
in what order. If Sort Working Sets is not enabled, working sets can also be rearranged directly in the
Package Explorer using drag and drop.
|
|
Assign working sets
|
To assign an element to a different working
set, select the element in the Package Explorer and choose Assign Working
Sets... from the context menu.
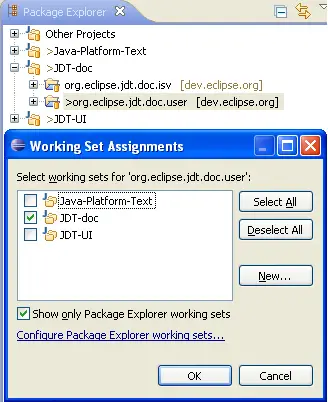
|
|
Declaration view
|
The Declaration view (
Window > Show View > Other... > Java > Declaration
) shows the source of the
element selected in the Java editor or in a Java view.

|
|
Javadoc view
|
The Javadoc view (
Window > Show View > Other... > Java > Javadoc
) shows the Javadoc of the element
selected in the Java editor or in a Java view.

|
|
Type Hierarchy view and method
implementations / definitions
|
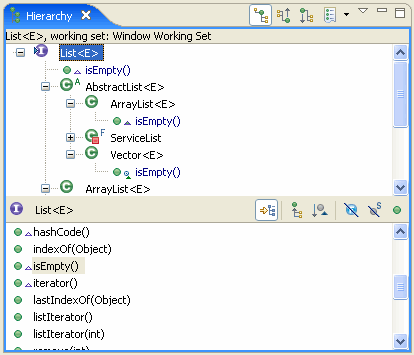
To find out
which types in a hierarchy override a method, use the 'Show Members in
Hierarchy' feature:
- Select the method to look at and press F4 (Navigate > Open
Type Hierarchy). This opens the type Hierarchy view on the
method's declaring type.
- With the method selected in the Hierarchy view, press the 'Lock
View and Show Members in Hierarchy' tool bar button.
The Hierarchy view now shows only types that implement or define
the 'locked' method. You can for example see that isEmpty() is
defined in List and implemented in ArrayList and Vector but
not in AbstractList.
|
|
Type Hierarchy view
supports grouping by defining type
|
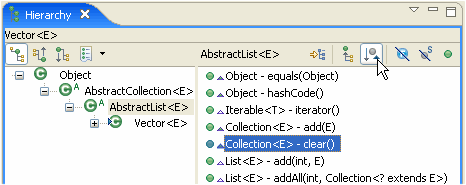
The type hierarchy method
view lets you sort the selected type's methods by its defining types.
For example, for AbstractList you can see that it contains methods
that were defined in Object, Collection and List:
|
|
Tricks in the type
hierarchy
|
- Focus the type hierarchy on a new type by pressing F4
(Navigate > Open Type Hierarchy) on an element or a selected
name.
- You can open the Hierarchy view not only on types but also on
packages, source folders, JAR archives and Java projects.
- You can Drag & Drop an element onto the Hierarchy view to
focus on that element.
- You can change the orientation (from the default vertical to
horizontal) of the Hierarchy view from the view's toolbar menu.
|
|
Structural compare of Java source
|
A structural comparison of Java source
ignores the textual order of Java elements like methods and fields
and shows more clearly which elements were changed, added, or removed.
For initiating a structural comparison of Java files you have two
options:
- Select two Java compilation units and choose Compare With
> Each Other from the view's context menu. If the files
have differences, they are opened into a Compare Editor. The top
pane shows the differing Java elements; double clicking on one of
them shows the source of the element in the bottom pane.
- In any context where a file comparison is involved (e.g. a CVS
Synchronization) a double click on a Java file not only shows the
content of the file in a text compare viewer, but it also performs a
structural compare and opens a new pane showing the results.
You can even ignore formatting changes when performing
the structural compare: turn on the Ignore Whitespace
option via the Compare Editor's toolbar button, or a compare viewer's context menu. |
|
Structural compare of property
files
|
A structural comparison of Java
property files (extension: .properties) ignores the textual order of
properties and shows which properties were changed, added, or
removed.
For initiating a structural comparison of property files you have two
options:
- Select two files in the Package Explorer or Navigator and choose
Compare With > Each Other from the view's context
menu.
- In any context where a file comparison is involved (e.g. a CVS
Synchronization) a double click on a property file not only shows
the content of the file in a text compare viewer, but it also
performs a structural compare and opens a new pane showing the
results.
|
|
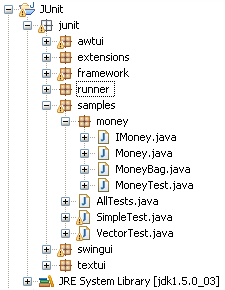
Hierarchical vs. flat
presentation of packages
|
An option on the Java
Packages (and Package Explorer) view menu allows you to change the
way packages are displayed. Package Presentation > Hierarchical displays packages in
a tree, with sub-packages below packages; Package Presentation > Flat displays them
in the standard arrangement, as a flat list with all packages and
sub-packages as siblings.
|
|
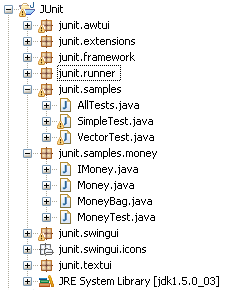
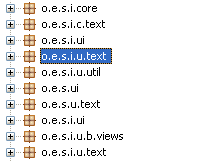
Logical packages
|
The Java Packages view
(Java Browsing perspective) coalesces packages of the same name
across source folders within a project. The screenshot shows the Packages view
containing a logical package.
|
|
Compress package names
|
If your package names are
very long, you can configure a compressed name that appears in the viewers.
Configuration of the compression pattern is done in the
Java > Appearance
preference page.
Using this example, packages are rendered the following way:
|
|
Manipulating the Java
build path directly in the Package Explorer
|
Instead of manipulating the Java Build path on Project
> Properties > Java Build Path, use the actions in the Package Explorer's context menu.
You can for example add new source folders, archives and libraries to the build path or in- and exclude file and folders from a source folder.
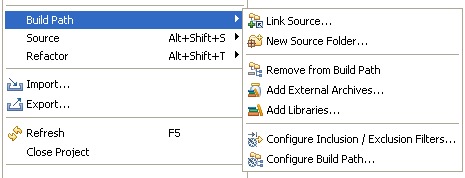
|
|
Paste code snippets to create a type
|
You can paste a snippet of code containing a Java type directly
into a package or source folder to create a new compilation unit.
For example, select and copy this source code:
package pack;
public class HelloWorld {
    public static void main(String[] args) {
        System.out.println("Hello World");
    }
}
Then select a source folder in the Package Explorer and use Ctrl+V (Edit > Paste).
This automatically creates a new package 'pack' and file 'HelloWorld.java' with the copied content.
You can also paste a method or a set of statements; Eclipse will create the required enclosing
elements for you.
If you paste while nothing is selected in the Package Explorer, Eclipse
even creates a new Java Project and create the *.java file there.
Furthermore, the clipboard can also contain multiple package and type declarations,
in which case Eclipse will create all the necessary packages and *.java files on paste.
|
|
Paste patch into Package Explorer
|
What's the quickest way to apply a patch from Bugzilla? Just open the attachment,
copy the patch to the clipboard and paste it into the Package Explorer.
|
|
Grouping Java problems
|
Configure the Problems view to group Java problems into categories with Group by > Java Problem Type
in the view menu.

You can control if a configurable error is intended to be fatal or not at the bottom of the
Java > Compiler > Errors/Warnings
preference page.
|
|
Java type indicator
|
Enable the Java Type Indicator on the
General > Appearance > Label Decoration
preference page to find
out what the first type in a compilation unit or class file is. An adornment is shown for interfaces, annotations, and enums, while an ordinary class stays undecorated.

|
Miscellaneous
|
Project specific
preferences
|
All code style and compiler options can be defined per project.
Open the project property pages with Project > Properties on a project or use the link on the workspace preferences (e.g. the
Java > Code Style
preference page)
to open a project property page and enable project specific settings.
The project specific settings are stored in a configuration file inside the project (in the '.settings' folder). When you share a project in a team, team members will also get these project specific settings. |
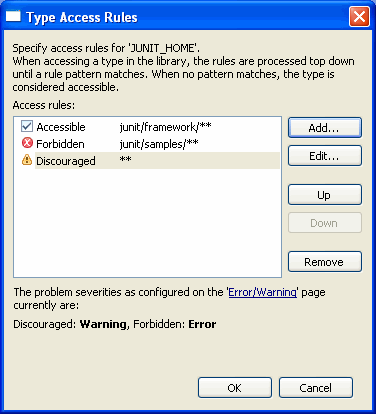
Access rules
|
Access rules give you the possibility to enforce API rules for types from referenced libraries. On the Java build path page (Project
> Properties > Java Build Path) edit the 'Access Rules' node available on referenced projects, archives, class folders and libraries.
Packages or types in these references can be classified as:
- Accessible
- Discouraged
- Forbidden
According to the settings on the
Java > Compiler > Errors/Warnings
preference page,
the compiler will mark discouraged and forbidden references with warning or errors.
|
|
JUnit
|
Select a JUnit test method
in a view and choose Run > JUnit Test from the context menu or Run
> Run As > JUnit Test from the main menu. This
creates a launch configuration to run the selected test. |
|
Hide JUnit view until
errors or failures occur
|
You can configure the JUnit view
to only open when there are errors or failures. To do so enable Activate on Errors/Failures only
in the JUnit view menu. That way, you can have
the view set as a fast view and never look at it when there are no
failing tests. While there are no problems in your tests you will see
this icon  (the
number of small green squares will grow, indicating progress)
while running them and this icon (the
number of small green squares will grow, indicating progress)
while running them and this icon  after they are finished. If, however,
errors or failures occur, the icon will change to
after they are finished. If, however,
errors or failures occur, the icon will change to  (or
(or  if
tests are finished) and the JUnit view will appear.
if
tests are finished) and the JUnit view will appear. |
|
Content assist in dialog fields
|
Content assist (Ctrl+Space) is also available in input fields
of various Java dialogs. Look for a small light bulb icon beside the
field when it has focus.
|
|
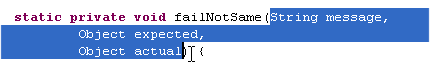
Smart caret positioning in dialogs showing Java names
|
Text fields for editing Java names support smart caret positioning. Use Ctrl+Left and Ctrl+Right to
stop at camel case boundaries inside a name. Use Ctrl+Shift+Left and Ctrl+Shift+Right to extend the selection in small steps.
Use Ctrl+Delete to delete the next and Ctrl+Backspace to delete the previous part of a name.
|

|
Ctrl+Right:
|

|
Ctrl+Shift+Right:
|

|
write "Equal":
|

|
Ctrl+Delete:
|

|
write "To":
|

|
|
|
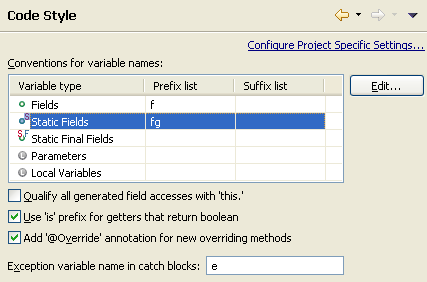
Define prefixes or
suffixes for fields, parameters and local variables
|
You can configure
the prefix or suffix for fields, static fields, parameters, and local variables.
These settings on the
Java > Code Style
preference page are used
in content assist, quick fix, and refactoring whenever a variable
name is computed.
|
|
Organize Imports works
on more than single files
|
You can invoke Source > Organize
Imports on sets of compilation units, packages, source folders or
Java projects. |
|
Organize imports on save
|
Eclipse can automatically organize imports whenever you save an editor.
This feature can be enabled globally on the
Java > Editor > Save Actions
preference page.
The save actions can also be configured per project, which
makes it easy to enforce a project-wide standard by sharing
the settings across a team:
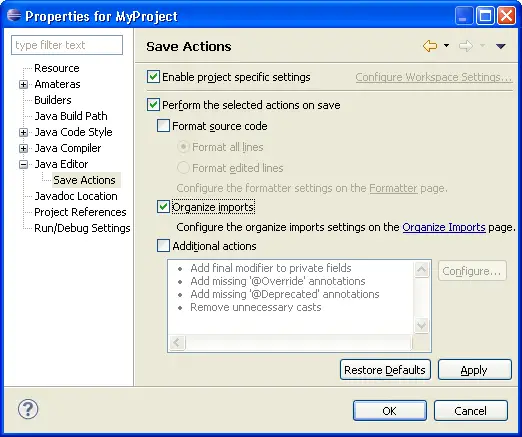
Besides organizing imports, save actions can also format code and
perform other clean ups.
|
|
Format selection
|
Select multiple
Java files to format and choose Source > Format to format them
all. The format action is also available on packages, source folders
or Java projects.
In the Java Editor, Source > Format (Ctrl+Shift+F) formats just
the selected region. If nothing is selected, the whole file gets formatted.
|
|
Select execution environment
for Java project
|
When you create a Java project that you want
to share with a team, it is a good idea to use an execution environment
instead of a specific JRE.
Execution environments are symbolic representations of JREs with standardized
entries like 'J2SE-1.4', 'J2SE-1.5'. That means no file system path will
go into the shared build path.
JREs can be assigned to the environments on the
Java > Installed JREs > Execution Environments
preference page.
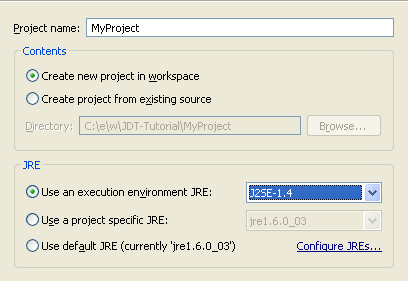
To set a project specific JRE of an existing project, open the
project's Java Build path property page (Project > Properties > Java Build Path), then the Libraries page, select
'JRE System Library' and press Edit. In the 'Edit Library' dialog you can select either an Execution Environment, a project specific
JRE, or the workspace default JRE.
|
|
Use drag and drop
|
Drag and Drop is a handy replacement of Edit > Cut and Edit > Paste
, or Edit > Copy and Edit > Paste. Hold
down the Ctrl key while dropping to change from move to copy.
Important to know:
- If you move Java
compilation units between packages by Drag & Drop, this will behave like a refactoring move - all missing
imports will be added and references updated
-
If you drag and drop source elements like types or methods, this will only copy or move the corresponding
source code - no references will be updated
|
|
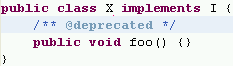
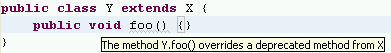
Propagating deprecation
tag
|
The Java compiler can be configured to diagnose deprecation using
options on the
Java > Compiler > Errors/Warnings
preference page.
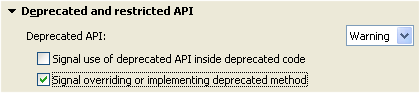
Using this configuration, the result is:
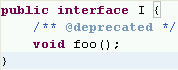
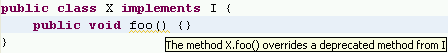
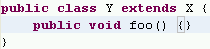
If you're unable to fix a usage of a deprecated construct, we recommend that you
tag the enclosing method, field or type as deprecated.
This way, you acknowledge that you did override a deprecated construct,
and the deprecation flag is propagated to further dependents.
|
|
Recovering from abnormal
inconsistencies
|
In the rare event of a dysfunction, JDT could reveal some inconsistencies
such as:
- missing results in a Java Search or Open Type
- invalid items in Package Explorer
To bring JDT into a consistent state again, the following actions need to be performed
in this exact order:
- Close all projects using navigator Close Project menu action
- Exit and restart Eclipse
- Open all projects using navigator Open Project menu action
- Manually trigger a clean build of entire workspace (Project >
Clean...)
|
Debugging
|
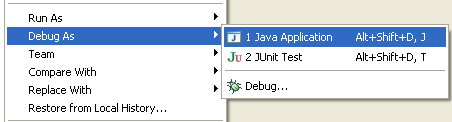
Launching from the context menu
|
You can run and debug Java applications from the context menu.
You can launch a source file, package, method, type, etc. by
choosing Run As (or Debug As) > Java Application
from the context menu in a view or editor. Alternatively, you can
use the Java application launch shortcut key binding (Alt+Shift+D, J). The
top level Run As (or Debug As) actions are also
sensitive to the current selection or active editor.
|
|
Evaluations in the
debugger
|
Snippet evaluation is available from a number of places in the
debugger. Choosing Display or Inspect from the context
menu of the editor or Variables view will show the result in a
pop-up whose result can be sent to the Display or Expressions
views.
|
|
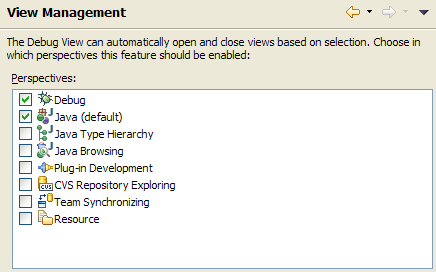
View management in non-Debug perspectives
|
The Debug view automatically manages debug related views based on the view selection
(displaying Java views for Java stack frames and C views for C stack frames,
for example). By default, this automatic view management only occurs in
the Debug perspective, but you can enable it for other perspectives via
the View Management preference page available from the Debug
view toolbar pull down.
|
|
Environment variables
|
You can specify the environment used to launch Java applications via
the Environment tab.
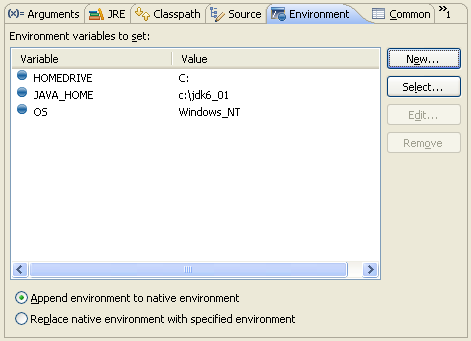
|
|
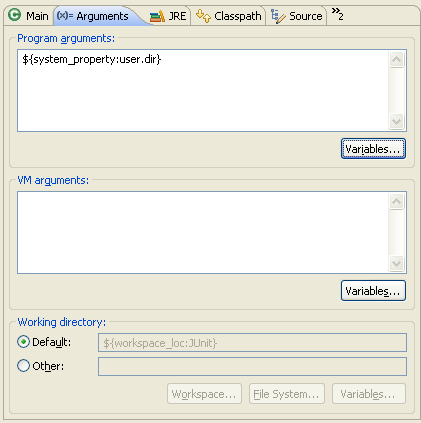
String substitutions
|
Variables are supported for many parameters of Java Application launch
configurations. Most fields that support variables have a Variables...
button next to them, such as the program and VM arguments fields. The
Main Type field supports variables as well; the ${java_type_name}
variable allows you to create a configuration that will run the selected
type.
|
|
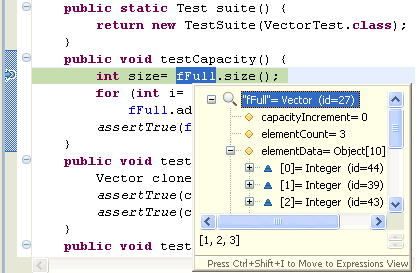
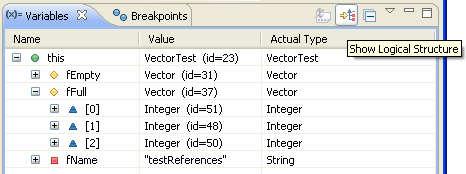
Logical structures
|
The Logical Structures toggle on the Variables view toolbar
presents alternate structures for common types. JDT provides logical views
for Maps, Collections, and SWT Composites. You can define
logical structures for other types from the Logical Structures
preference page.
|
|
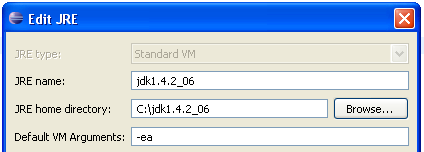
Default VM arguments
|
If you specify the same arguments to a certain VM frequently,
you can configure Default VM Arguments in the Installed JREs
preference page. This is more convenient than specifying them for
each launch configuration.
|
|
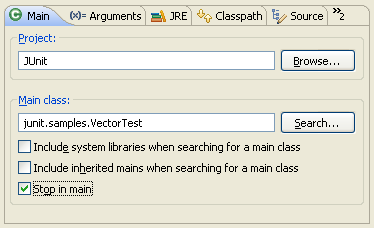
Stop in main
|
You can use Stop in main in a Java Application launch
configuration to cause your program to stop at the first executable
line of the main method when you run it under debug mode.
|
|
Conditional breakpoints
|
You can use conditional breakpoints in
Breakpoint Properties... to control when a breakpoint
actually halts execution. You can specify whether you want the
breakpoint to suspend execution only when the condition is true, or
when the condition value changes.
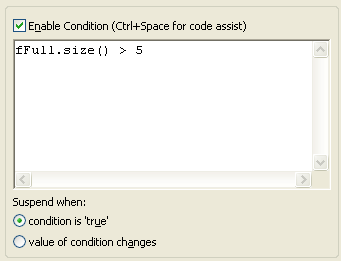
|
|
Disabling breakpoints
|
If you find yourself frequently adding and removing a breakpoint
in the same place, consider disabling the breakpoint when you don't
need it and enabling it when needed again. This can be done using Disable
Breakpoint in the breakpoint context menu or by unchecking the
breakpoint in the Breakpoints view.
You can also temporarily disable all breakpoints using the Skip
All Breakpoints action in the Breakpoints view toolbar.
This will tell the debugger to skip all breakpoints while maintaining
their current enabled state.
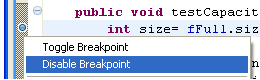
|
|
Changing variable values
|
When a thread is suspended in the debugger, you can change the values
of Java primitives and Strings in the Variables view. From the
variable's context menu, choose Change Variable Value. You can
also change the value by typing a new value into the Details pane and
using the Assign Value action in the context menu (CTRL+S
key binding).
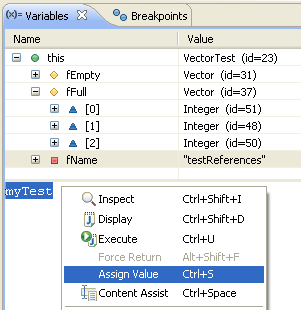
|
|
Variable values in hover help
|
When a thread is suspended and the
cursor is placed over a variable in the Java editor, the value of
that variable is displayed as hover help.
|
|
Drop to frame
|
When stepping through your code, you might occasionally step too
far, or step over a line you meant to step into. Rather than
restarting your debug session, you can use the Drop to Frame
action to quickly go back to the beginning of a method. Select the
stack frame corresponding to the Java method you wish to restart, and
select Drop to Frame from Debug view toolbar or the
stack frame's context menu. The current instruction pointer will be
reset to the first executable statement in the method. This works for
non-top stack frames as well.
Note that Drop to frame is only available when debugging with a
1.4 or higher VM, or the J9 VM. There are some situations where a JVM
may be unable to pop the desired frames from the stack. For example,
it is generally impossible to drop to the bottom frame of the stack
or to any frame below a native method.
|
|
Hot code replace
|
The debugger supports Hot Code Replace when
debugging with a 1.4 or higher VM, or the J9 VM. This lets you make changes
to code you are currently debugging. Note that some changes such as new
or deleted methods, class variables or inner classes cannot be hot swapped,
depending on the support provided by a particular VM. |
|
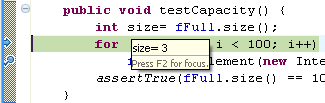
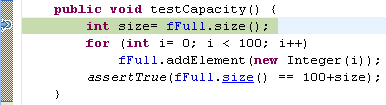
Stepping into selections and hyperlink
debugging
|
The Java debugger allows you to step into a single method within a
series of chained or nested method calls. Simply highlight the method
you wish to step into and select Step into Selection from the
Java editor context menu.
This feature works in places other than the currently executing
line. Try debugging to a breakpoint and step into a method a few
lines below the current instruction pointer.
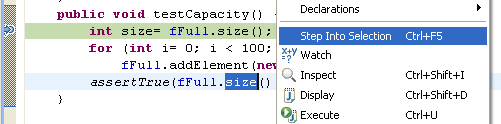
You can also step into a method by using hyperlink navigation. Simply
place the cursor over the method you wish to step into and use Ctrl+Alt+Click
to step into the method (rather than Ctrl+Click which
will navigate to the source code).
|
|
Console pin and lock
|
Output displayed in the console can be locked
to a specific process via the Pin Console action in the
Console view toolbar. There's also a Scroll Lock action
that stops the console from scrolling as new output is appended. |
|
Creating watch items
|
A watch item is an expression in the Expressions
view whose value is updated as you debug. You can create watch items from
the Java editor by selecting an expression or variable and choosing Watch
from its context menu or the top-level Run menu. |
|
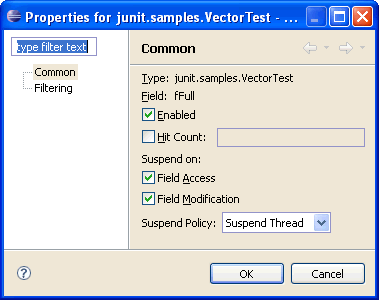
Watch points
|
A watch point is a breakpoint that suspends execution whenever a specified
field is accessed or modified. To set a watchpoint, select a field in
the Outline view and choose Toggle Watchpoint from its context
menu. To configure a watchpoint, select the watchpoint in the Breakpoints
view and choose Properties... from its context menu. The most
important properties for this type of breakpoint are the Access
and Modification checkboxes which control when the breakpoint
can suspend execution.
|
|
Threads and monitors
|
The Java debugger optionally displays monitor information
in the Debug view. Use the Show Monitors action in the
Debug view drop down menu to show which threads are holding locks and
which are waiting to acquire locks. Threads involved in a deadlock
are rendered in red.
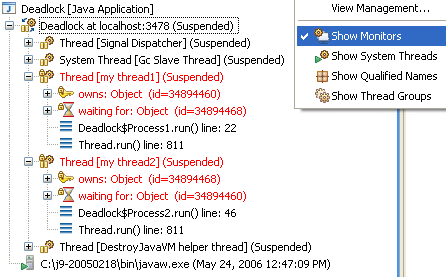
|
|
Step filters
|
Step filters prevent the debugger from suspending
in specified classes and packages when stepping into code. Step filters
are established with the
Java > Debug > Step Filtering
preference page.
When the Use Step Filters toggle (on the debug
toolbar and menu) is on, step filters are applied to all step actions. In
the Debug view, the selected stack frame's package or declaring type can
be quickly added to the list of filters by selecting Filter Type
or Filter Package from the stack frame's context menu. |
|
Using the scrapbook
|
If you want to experiment with API or test out a new algorithm, it's
frequently easier to use a Java scrapbook page than create a new class.
A scrapbook page is a container for random snippets of code that you can
execute at any time without a context. To create a scrapbook page, create
a new file with a .jpage extension (or use the
New Scrapbook Page
wizard).
Enter whatever code you wish to execute and then select it. There are three
ways to execute your code:
- Execute the selected code and place the returned result in an inspect
popup
- Execute the selected code and place the String result right in
the scrapbook page
- Execute the selected code (and ignore any returned result)
These actions are in the workbench toolbar and also in the
scrapbook page's context menu.
|
Editing
launch
configurations
|
Holding down the Ctrl key and
making a selection from the Run or Debug drop-down menu
opens the associated launch configuration for editing. The launch
configuration can also be opened from the context menu associated
with any item in the Debug view. |
|
Favorite launch configurations
|
Launch configurations appear in the Run/Debug drop-down menus in most
recently launched order. However it is possible to force a launch configuration
to always appear at the top of the drop-downs by making the configuration
a 'favorite'. Use the Organize Favorites... action from
the appropriate drop down menu to configure your favorite launch configurations.
|
|
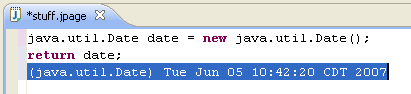
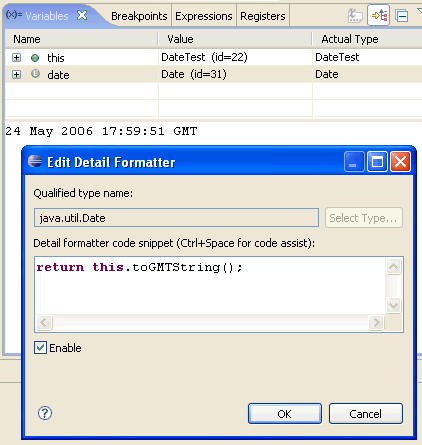
Detail formatters
|
In the Variables & Expressions views, the detail
pane shows an expanded representation of the currently selected
variable. By default, this expanded representation is the result of
calling toString() on the selected object, but you can create
a custom detail formatter that will be used instead by choosing New
Detail Formatter from the variable's context menu. This detail
formatter will be used for all objects of the same type. You can view
and edit all detail formatters in the
Java > Debug > Detail Formatters
preference page.
|
|
Running code with compile errors
|
You can run and debug code that did not compile cleanly. The only
difference between running code with and without compile errors is
that if a line of code with a compile error is executed, one of two
things will happen:
- If the 'Suspend execution on compilation errors' preference on the
Java > Debug
preference page is set and you are
debugging, the debug session will suspend as if a breakpoint had
been hit. Note that if your VM supports Hot Code Replace, you could
then fix the compilation error and resume debugging
- Otherwise, execution will terminate with a 'unresolved
compilation' error
It is important to emphasize that as long as your execution path
avoids lines of code with compile errors, you can run and debug just
as you normally do.
|
|
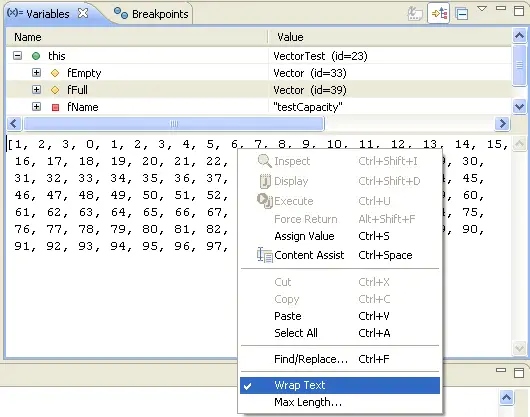
Word wrap in Variables view
|
The details area of the debugger's Variables
and Expressions views supports word wrap, available from the
view drop-down menu.
|
|
Code assist in the debugger
|
Code assist is available in many contexts beyond writing code in
the Java editor:
- When entering a breakpoint condition
- In the Details pane of the Variables & Expressions
view
- When entering a Detail Formatter code snippet
- When entering a Logical Structure code snippet
- When entering code in a Scrapbook page
- In the Display view
|
|
Command line details
|
You can always see the exact command
line used to launch a program in run or debug mode by selecting Properties
from the context menu of a process or debug target, even if the
launch has terminated.
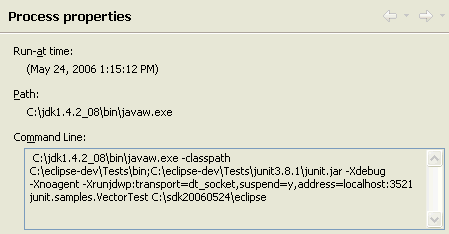
|
Stack trace
hyperlinks
|
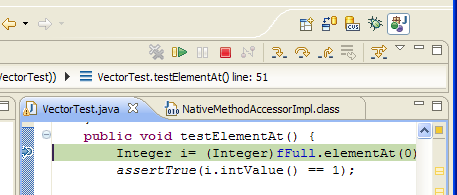
Java stack traces in the console appear with hyperlinks. When you place
the mouse over a line in a stack trace the pointer changes to the hand.
Pressing the mouse button opens the
associated Java source file and positions the cursor at the corresponding
line. Pressing the mouse button on the exception name at the top of the
stack trace will create an exception breakpoint.
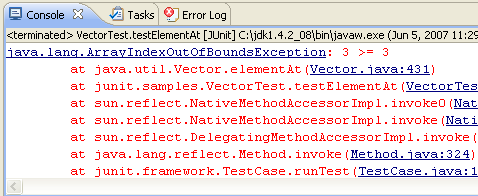
|
|
Debugging in the Java perspective
|
You can debug in the Java perspective by configuring the Run/Debug > View Management preferences. Select the perspectives you want to be debug from.
Ensure the preference to activate the debug view when a breakpoint is hit is turned on (via the top level Run/Debug preference page).
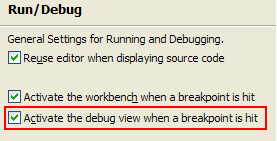
You can disable the perspective switching prompt on the Run/Debug > Perspectives preference page. With these settings the Debug view will automatically open in the Java perspective when a breakpoint is hit.
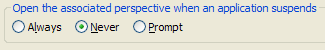
By placing the Debug view at the top of the perspective and resizing it's height to the size of one element, the view will switch to a bread crumb presentation. This minimizes the amount of screen space the view consumes.
|
|
|
|