Follow Techotopia on Twitter

On-line Guides
All Guides
eBook Store
iOS / Android
Linux for Beginners
Office Productivity
Linux Installation
Linux Security
Linux Utilities
Linux Virtualization
Linux Kernel
System/Network Admin
Programming
Scripting Languages
Development Tools
Web Development
GUI Toolkits/Desktop
Databases
Mail Systems
openSolaris
Eclipse Documentation
Techotopia.com
Virtuatopia.com
Answertopia.com

How To Guides
Virtualization
General System Admin
Linux Security
Linux Filesystems
Web Servers
Graphics & Desktop
PC Hardware
Windows
Problem Solutions
Privacy Policy


8.5. Endpoints

Statistics of the endpoints captured.

[Tip] Tip!

If you are looking for a feature other network tools call a hostlist , here is the right place to look. The list of Ethernet or IP endpoints is usually what you're looking for.

8.5.1. What is an Endpoint?

A network endpoint is the logical endpoint of separate protocol traffic of a specific protocol layer. The endpoint statistics of Wireshark will take the following endpoints into account:

  • Ethernet : an Ethernet endpoint is identical to the Ethernet's MAC address.

  • Fibre Channel : XXX - insert info here.

  • FDDI : a FDDI endpoint is identical to the FDDI MAC address.

  • IPv4 : an IP endpoint is identical to its IP address.

  • IPX : XXX - insert info here.

  • TCP : a TCP endpoint is a combination of the IP address and the TCP port used, so different TCP ports on the same IP address are different TCP endpoints.

  • Token Ring : a Token Ring endpoint is identical to the Token Ring MAC address.

  • UDP : a UDP endpoint is a combination of the IP address and the UDP port used, so different UDP ports on the same IP address are different UDP endpoints.

[Note] Broadcast / multicast endpoints

Broadcast / multicast traffic will be shown separately as additional endpoints. Of course, as these endpoints are virtual endpoints, the real traffic will be received by all (multicast: some) of the listed unicast endpoints.

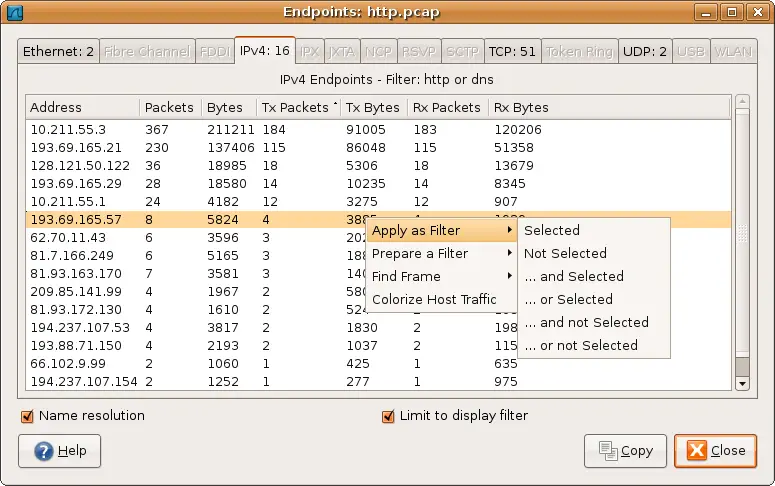
8.5.2. The "Endpoints" window

This window shows statistics about the endpoints captured.

Figure 8.4. The "Endpoints" window

The "Endpoints" window

For each supported protocol, a tab is shown in this window. Each tab label shows the number of endpoints captured (e.g. the tab label "Ethernet: 5" tells you that five ethernet endpoints have been captured). If no endpoints of a specific protocol were captured, the tab label will be greyed out (although the related page can still be selected).

Each row in the list shows the statistical values for exactly one endpoint.

Name resolution will be done if selected in the window and if it is active for the specific protocol layer (MAC layer for the selected Ethernet endpoints page). As you might have noticed, the first row has a name resolution of the first three bytes "Netgear", the second row's address was resolved to an IP address (using ARP) and the third was resolved to a broadcast (unresolved this would still be: ff:ff:ff:ff:ff:ff); the last two Ethernet addresses remain unresolved.

Limit to display filter will only show conversations matching the current display filter.

The copy button will copy the list values to the clipboard in CSV (Comma Separated Values) format.

[Tip] Tip!

This window will be updated frequently, so it will be useful, even if you open it before (or while) you are doing a live capture.

8.5.3. The protocol specific "Endpoint List" windows

Before the combined window described above was available, each of its pages was shown as a separate window. Even though the combined window is much more convenient to use, these separate windows are still available. The main reason is that they might process faster for very large capture files. However, as the functionality is exactly the same as in the combined window, they won't be discussed in detail here.


  Published under the terms fo the GNU General Public License Design by Interspire