Follow Techotopia on Twitter

On-line Guides
All Guides
eBook Store
iOS / Android
Linux for Beginners
Office Productivity
Linux Installation
Linux Security
Linux Utilities
Linux Virtualization
Linux Kernel
System/Network Admin
Programming
Scripting Languages
Development Tools
Web Development
GUI Toolkits/Desktop
Databases
Mail Systems
openSolaris
Eclipse Documentation
Techotopia.com
Virtuatopia.com
Answertopia.com

How To Guides
Virtualization
General System Admin
Linux Security
Linux Filesystems
Web Servers
Graphics & Desktop
PC Hardware
Windows
Problem Solutions
Privacy Policy


Eclipse BIRT Report Developer Guide
Previous Page Home Next Page

Previous Next

Before you start to design a chart, you must create a report design file for the chart, then set up the data source and data set that the chart uses. These tasks are discussed in detail in earlier sections of this book and in a tutorial in which you build a sample report. This tutorial builds on that knowledge, explaining how to select the data from the database that you use to build a sample pie chart.

1
Choose File NewReport and name the new report design Chart.rptdesign. Choose Finish.


This SELECT statement gets values from the ProductLine column in the Products table, groups the results by product line, and calculates the sum of the order quantities for each group.

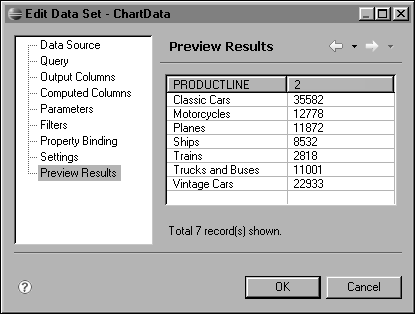
Figure 14-1 Previewing the data set

Figure 14‑1
The first column lists product-line names. The second column shows the total orders for each product line. By default, BIRT uses sequential numbers to name generated columns, such as the sum column named 2 in Figure 14‑1.
5
To rename the sum column to something more descriptive, choose Output Columns from the list in the left pane. Use the following text for the alias for the 2 column:

(c) Copyright Actuate Corporation 2009


  Published under the terms of the Eclipse Public License Version 1.0 ("EPL") Design by Interspire