6.5.2. The Callgraph View
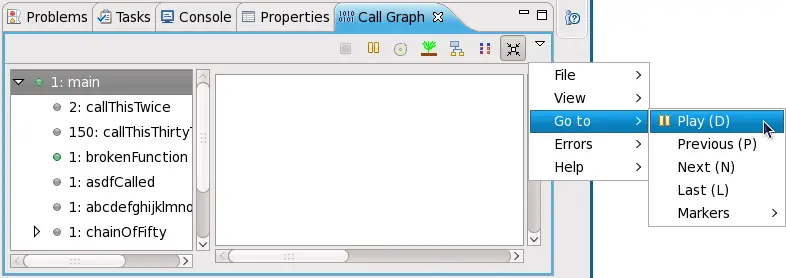
The view's toolbar allows you to select a perspective and perform other functions. To play a visual representation of a function trace, click the button then navigate to . This menu will allow you to pause, step through, or mark each function as it executes.
You can also save or load a profile run through the . To do either, navigate to under the ; this will display different options relating to saving and loading profile runs.
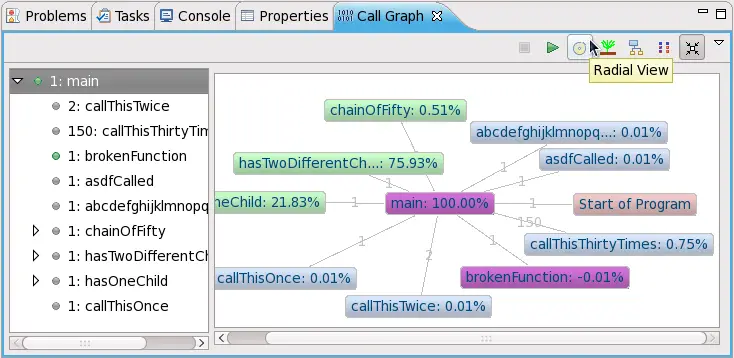
The displays all functions branching out from main(), with each function represented as a node. A purple node means that the program terminates at the function. A green node signifies that the function call has nested functions, whereas gray nodes signify no nest functions. Double-clicking on a node will show its parent (colored pink) and children. The lines connecting different nodes also display how many times main() called each function.
The left window of the lists all of the functions shown in the view. This window also allows you to view nested functions, if any. A green bullet point means the program either starts or terminates at that function.
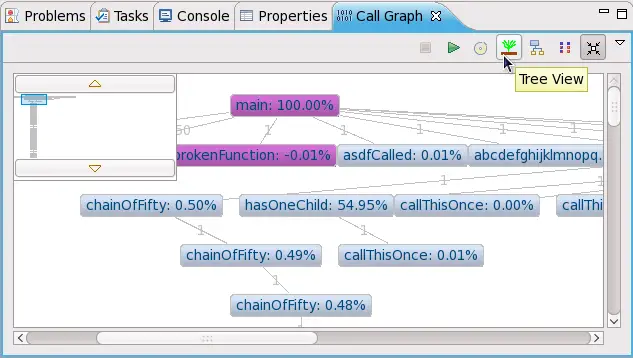
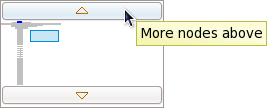
The is similar to the , except that it only displays all descendants of a selected node ( only displays functions one call depth away from a selected node). The top left of also includes a thumbnail viewer to help you navigate through different call depths of the function tree.
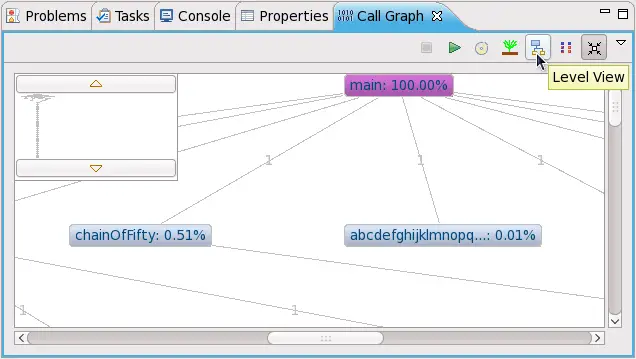
displays all function calls and any nested function calls branching out from a selected node. However, groups all functions of the same call depth together, giving a clearer visualization of a program's function call execution sequences. also lets you navigate through different call depths using the thumbnail viewer's and buttons.
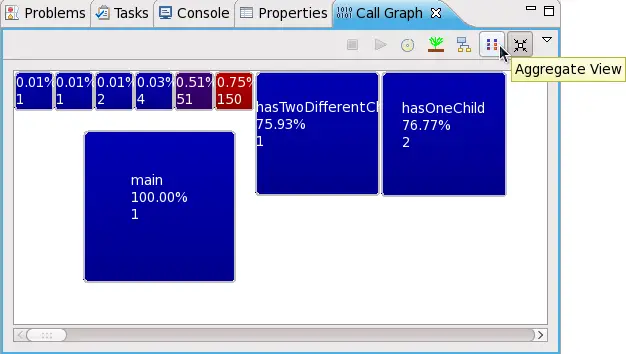
The depicts all functions as boxes; the size of each box represents a function's execution time
relative to the total running time of the program. Darker-colored boxes represent functions that are called more times relative to others; for example, in
Figure 6.10, “Aggregate View”, the
CallThisThirtyTimes function is called the most number of times (150).
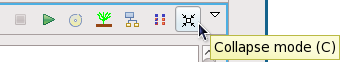
The view's toolbar also features a button. This groups all identical functions (i.e. those with identical names and call histories) together into one node. Doing so can be helpful in reducing screen clutter for programs where many functions get called multiple times.