Follow Techotopia on Twitter

On-line Guides
All Guides
eBook Store
iOS / Android
Linux for Beginners
Office Productivity
Linux Installation
Linux Security
Linux Utilities
Linux Virtualization
Linux Kernel
System/Network Admin
Programming
Scripting Languages
Development Tools
Web Development
GUI Toolkits/Desktop
Databases
Mail Systems
openSolaris
Eclipse Documentation
Techotopia.com
Virtuatopia.com
Answertopia.com

How To Guides
Virtualization
General System Admin
Linux Security
Linux Filesystems
Web Servers
Graphics & Desktop
PC Hardware
Windows
Problem Solutions
Privacy Policy


Red Hat Enterprise Linux 9 Essentials Book now available.

Purchase a copy of Red Hat Enterprise Linux 9 (RHEL 9) Essentials

Red Hat Enterprise Linux 9 Essentials Print and eBook (PDF) editions contain 34 chapters and 298 pages

Preview Book

6.5.  Eclipse-Callgraph

Red Hat Enterprise Linux 6 also includes the Eclipse-Callgraph plug-in, which provides a visual function trace of a program. This allows you to view a visualization of selected (or even all) functions used by the profiled application.
Eclipse-Callgraph uses SystemTap to perform a comprehensive function trace within a program. As such, you will need to install SystemTap along with the required kernel information packages. For more information about SystemTap, refer to Section 6.4, “SystemTap ” and other SystemTap documentation provided by Red Hat.
This plug-in allows you to profile C/C++ projects directly within the Eclipse IDE, providing various runtime details such as:
  • The relationship between function calls
  • Number of times each function was called
  • Time taken by each instance of a function (relative to the program's execution time)
  • Time taken by all instances of a function (relative to program's execution time)

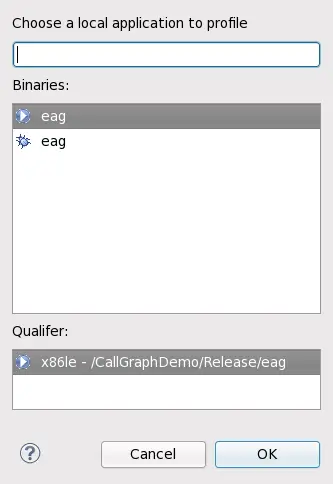
6.5.1. Launching a Profile With Eclipse-Callgraph

To profile an application with Eclipse-Callgraph, simply right-click on a project and navigate to Profile As > Function callgraph. This will open a dialogue from which you can select an executable to profile.
Eclipse-Callgraph Profile
Figure 6.3. Eclipse-Callgraph Profile

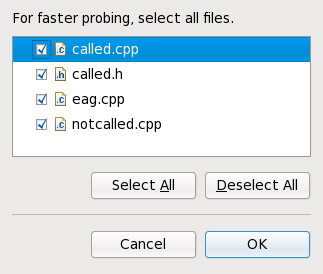
After selecting an executable to profile, Eclipse-Callgraph will ask which files to probe. By default, all source files in the project will be selected.
Selecting Files to Probe
Figure 6.4. Selecting Files to Probe


  Published under the terms of the Creative Commons License Design by Interspire