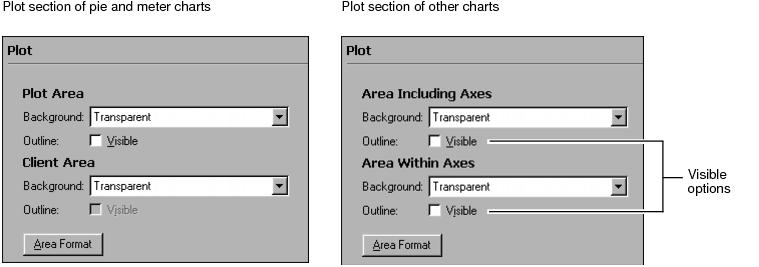
How to modify the plot area 1 Navigate to the Plot section of Format Chart. You see one of the two types of plot sections, as shown in Figure 16‑6, depending on the type of chart. Figure 16‑6 Plot section options in Format Chart 2 To make an outline of an area visible, select Visible in Outline for one or both areas. 3 To make other modifications to the area, choose Area Format. Figure 16‑7, shows the options you can set. Area Format exhibits the same nomenclature differences, depending on the type of chart you are building, as shown in Figure 16‑6. Figure 16‑7 Options in Area Format 4 Modify any of the following options: n Modify the outline style, width, or color. n Set padding to add space on any or all sides of the plot. n Choose Shadow, then use the color picker to select a shadow color. n Set where the plot appears in the chart. n Add space between the vertical edge of the plot and the vertical axis. n Add space between the horizontal edge of the plot and the horizontal axis. n Set padding around the plot area enclosed by the 2D axes. n Constrain the height or width of the plot block. 5 When you are done, close Area Format, then choose Finish on the chart builder to save your changes.