This example is often used within the consultancy field and is also used in several variations in the user support area. The task is to provide a means for one or more users to keep track of working hours.
A typical way of doing this is to create a spreadsheet per month and a sum sheet with all the results of one year. For each employee, there is one file.
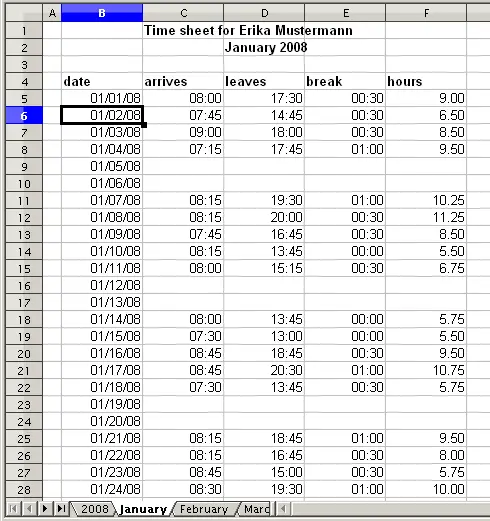
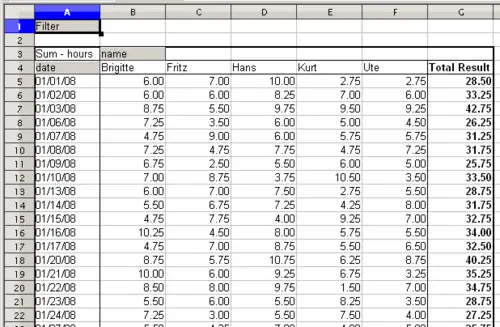
One month of timekeeping for one employee
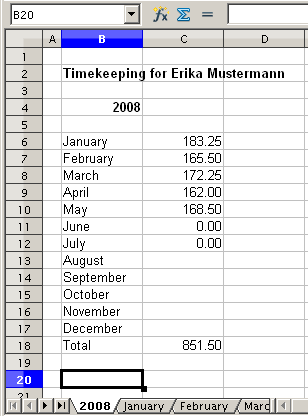
Yearly sums for one employee
Practical problems and questions
- It is very difficult and time-consuming to create the timekeeping table: 12 sheets that have to be copied from a raw template and adjusted for each month, and a sheet with all the yearly sums with references to all the other sheets. Users often search for a macro to make the creation easier.
- The shown file contains only the data of one employee. How can you get all the data for all the employees, so that you can have a summary of all the work hours from all employees of a department or the whole company?
- How can you compare employees and/or departments?
- The shown file contains data for one year. How can you compare it with the data of the previous years?
Solution
To use the DataPilot for this task, collect all data into one single table. This can be done either manually or by importing a file from an (electronic) timekeeping machine.
In very simple cases each employee takes care of their own working hours. If you need calculations that cover several employees, departments, or the whole company, just copy everything into one huge table.
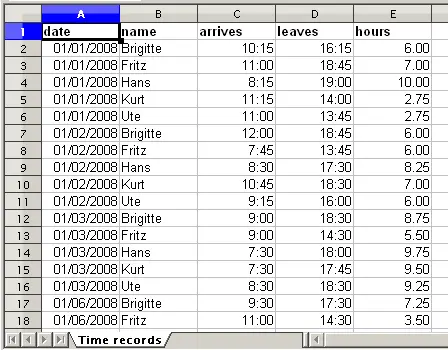
Data basis in Calc
Using the DataPilot just needs 12 mouse clicks and gives you within a few seconds a nice overview:
- Select the cell A1 (or any other single cell within the list).
- Choose Data > DataPilot > Start and click OK.
- On the DataPilot dialog:
- Drag the field date into the layout area Row fields.
- Drag the field hours into the layout area Data fields. Notice that it becomes Sum – hours.
- Drag the field name into the layout area Column fields.
- Click More to show more options in the lower part of the dialog.
- Choose – new sheet – for Results to.
- Click OK.
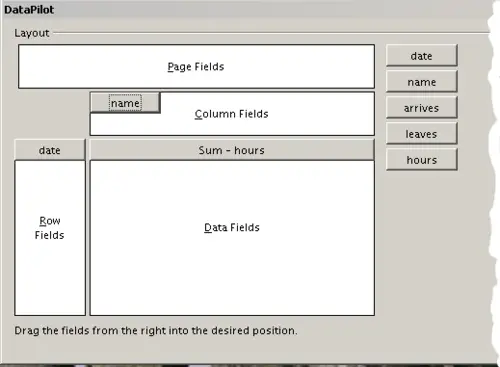
DataPilot dialog
The result appears on a new sheet.
The evaluation, done within seconds with DataPilot
The result is much more powerful than the solution with the classic formula-based calculation. For example, you can summarize the daily results to a monthly result very easily.
- To group together the rows, select the cell A5 (or any other cell that contains a date).
- Choose Data > Group and Outline > Group and click OK. The result is now grouped into months.
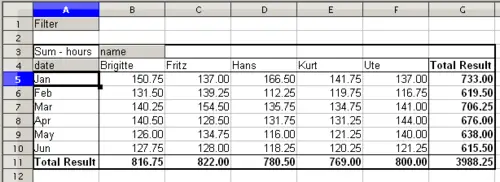
Monthly sums
- Select the cell A3 (or any other cell that contains a result of the DataPilot).
- Choose Data > DataPilot > Start.
- Double-click on the field Sum – hours to open the Data Field dialog.
- Click on More, to see more options.
- Switch the type of the displayed value to % of column.
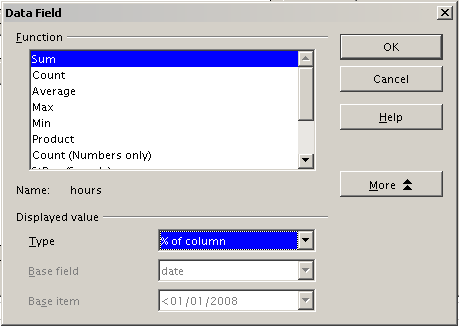
Properties of the data field
- Click OK twice.
In the result the percentages are shown as a decimal number. If you prefer to have a percent format, select the cells and click on the % icon in the menu bar.
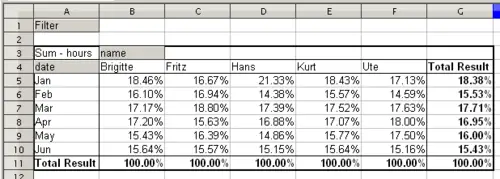
Result with percentages
To get a comparison between employees, start the DataPilot again:
- Select the cell A3 (or any other cell that contains a result of the DataPilot).
- Choose Data > DataPilot > Start.
- Double-click on the field Sum – hours to open the Data Field dialog.
- Click More, to see more options.
- Switch the Type of the displayed value to Difference from.
- Switch the Base field to name.
- Switch the Base item to Brigitte.
- Click OK twice.
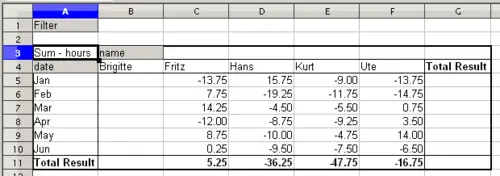
Absolute comparison with Brigitte
As a last example we switch to an accumulated view; that is, continuing sums of all values:
- Choose Data > DataPilot > Start.
- Double-click on the field Sums – hours to open the Data Field dialog.
- Click More, to see more options.
- Switch the type of the displayed value to Running total in.
- Switch the Base field to Date.
- Click OK twice.
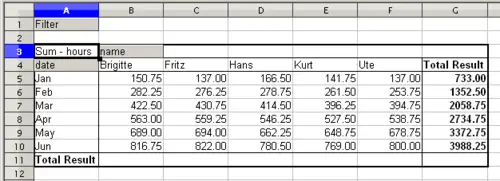
The DataPilot now shows accumulated values
Differences and advantages
These experiments show an important aspect of the DataPilot concept.
With the classic method you have to collect your data according to the way you want the result to be represented. This means you have to use a specific structure and you’re stuck with it.
The DataPilot works more like a real database. The source data are collected in a regular form, a somewhat primitive but universal structure: a simple spreadsheet that contains all data. Only when you want to look at it, you select which part of the data you want to use.


