Follow Techotopia on Twitter

On-line Guides
All Guides
eBook Store
iOS / Android
Linux for Beginners
Office Productivity
Linux Installation
Linux Security
Linux Utilities
Linux Virtualization
Linux Kernel
System/Network Admin
Programming
Scripting Languages
Development Tools
Web Development
GUI Toolkits/Desktop
Databases
Mail Systems
openSolaris
Eclipse Documentation
Techotopia.com
Virtuatopia.com
Answertopia.com

How To Guides
Virtualization
General System Admin
Linux Security
Linux Filesystems
Web Servers
Graphics & Desktop
PC Hardware
Windows
Problem Solutions
Privacy Policy


5.7. Curves Tool

Revision History
Revision $Revision: 1.37 $ 2006-02-09 j.h

The Curves tool is the most sophisticated tool used to adjust the tonality of images.

5.7.1. Activate Tool

The Curves Tool can be called in the following order, from the image-menu: Tools/ Color Tools/Curves .

5.7.2. Adjust Color Curves

Figure 8.69.  Curves tool

Curves tool
Channel

There are five options: Value for luminosity and contrast; Red, Green, and Blue for saturation; and Alpha (if your image has an Alpha channel).

Reset Channel

This button deletes all changes made to the selected channel.

Linear and Logarithmic buttons

These buttons allow to choose the Linear or Logarithmic type of the histogram. You can also use the same options in Tool Options dialog.

Main Editing Area

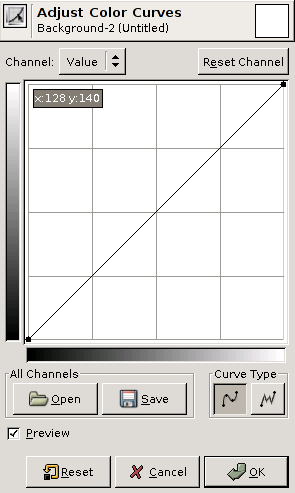
Input and Output Value Domains: The horizontal bar (x-axis) represents input values (they are value levels from 0 to 255). The vertical bar (y-axis) is only a scale for output colors of the selected channel.

The control curve is drawn on a grid and goes from bottom left corner to top right corner. Pointer x/y position is permanently displayed in top left part of the grid. If you click on the curve, a Control point is created. You can move it to bend the curve. If you click outside of the curve, a control point is also created, and the curve includes it automatically.

So, each point of the curve represents an 'x' level, corresponding to an 'y' color. If, for example, you move a curve segment to the right, i.e to highlights, you can see that these highlights are corresponding to darker output tones and that image pixels corresponding to this curve segment will go darker. With color channels, moving right will decrease saturation and can reach the complementary color.

To delete all control points (apart from both ends), click on the Initialize Channel button. To delete only one point, move it onto another point or to grid border.

All Channels

Open: This button allows you to select a file holding curve settings.

Save: Allows you to save any curves you have set to a file that can be loaded later.

Curve Type

Smooth: This mode constrains the curve type to a smooth line with tension. It provides a more realistic render than the following.

Free: You can draw your curve free-hand with the mouse. With curve segments scattered all over the grid, result will be surprising, but poorly repeatable.

Preview

The Preview button makes all changes to the levels dynamically so that the new level settings can be viewed immediately.

Tool Options dialog

Although this tool is not present in Tool box, nevertheless it has a Tool Option Dialog under the Toolbox. These options are described here:

Histogram Scale

These two options have the same action as the logarithmic and Linear buttons in the Curves dialog.

Sample Average

This slider sets the “radius” of the color-picking area. This area appears as a more or less enlarged square when you maintain the click on a pixel.


  Published under the terms of the GNU General Public License Design by Interspire