Profile Panel
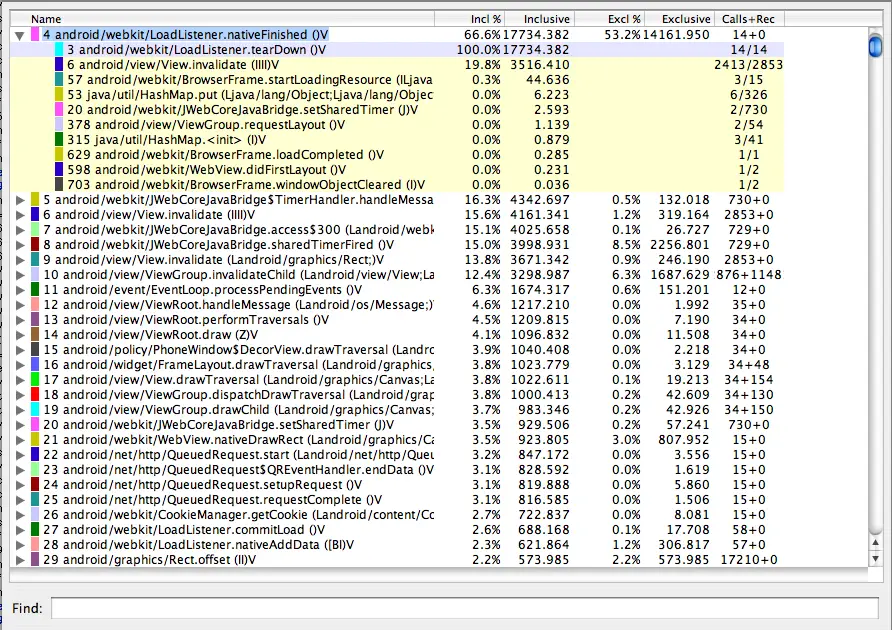
The image below shows the profile pane. The profile pane shows a
summary of all the time spent in a method. The table shows
both the inclusive and exclusive times (as well as the percentage of the total
time). Exclusive time is the time spent in the method. Inclusive time is the
time spent in the method plus the time spent in any called functions. We refer
to calling methods as "parents" and called methods as "children."
When a method is selected (by clicking on it), it expands to show the parents
and children. Parents are shown with a purple background and children
with a yellow background. The last column in the table shows the number of calls
to this method plus the number of recursive calls. The last column shows the
number of calls out of the total number of calls made to that method. In this
view, we can see that there were 14 calls to LoadListener.nativeFinished(); looking
at the timeline panel shows that one of those calls took an unusually
long time.